
Viewing Selected Metrics on Grafana Dashboards
On a dashboard, expand one or more rows to view detailed metrics, continuing the previous example using the System - Servers dashboard:
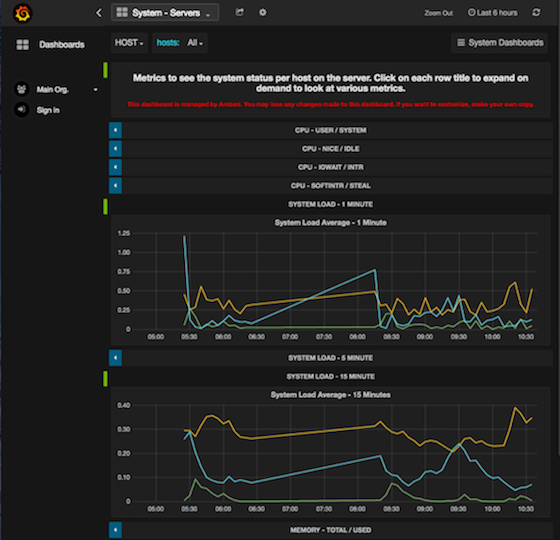
In the System - Servers dashboard, click a row name. For example, click System Load Average - 1 Minute.
The row expands to display a chart that shows metrics information: in this example, the System Load Average - 1 Minute and the System Load Average - 15 Minute rows: