
Viewing Grafana Dashboards
On the Grafana home page, Dashboards provides a short list of links to AMS, Ambari server, Druid and HBase metrics.
To view specific metrics included in the list:
Steps
In Grafana, browse to Dashboards.
Click a dashboard name.
To see more available dashboards, click the Home list.
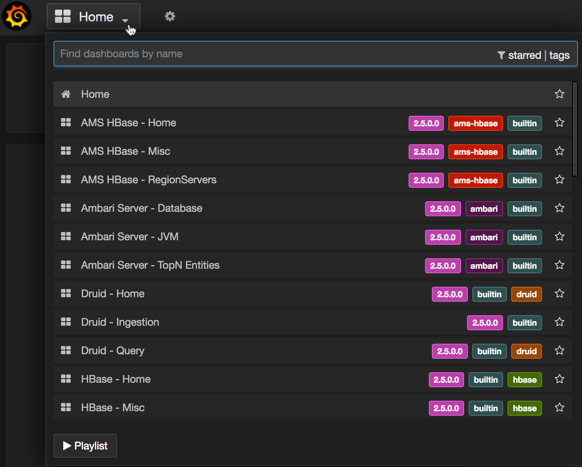
Scroll down to view the whole list.
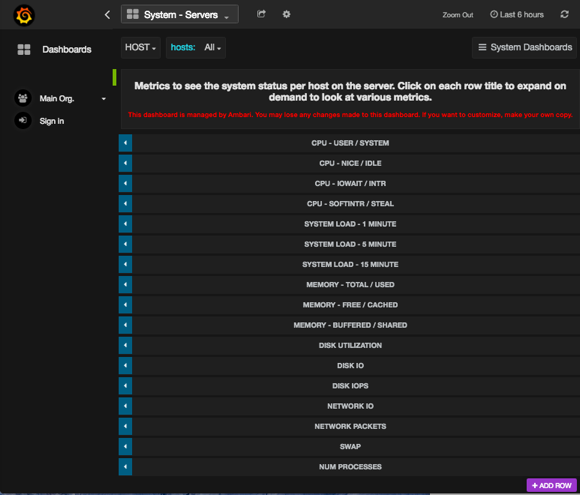
Click a dashboard name, for example System - Servers.
The System - Servers dashboard opens: