
Creating Insight Slices
The following steps demonstrate a typical flow for creating a slice:
-
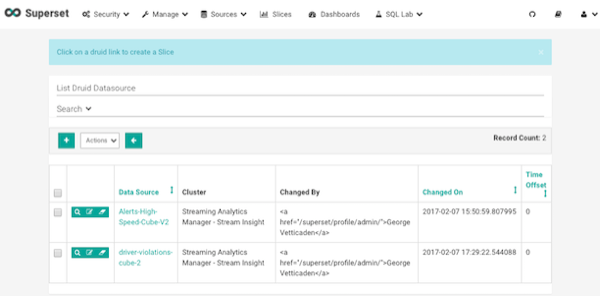
Select the Druid Data Source that you want to use for the new visualization:
-
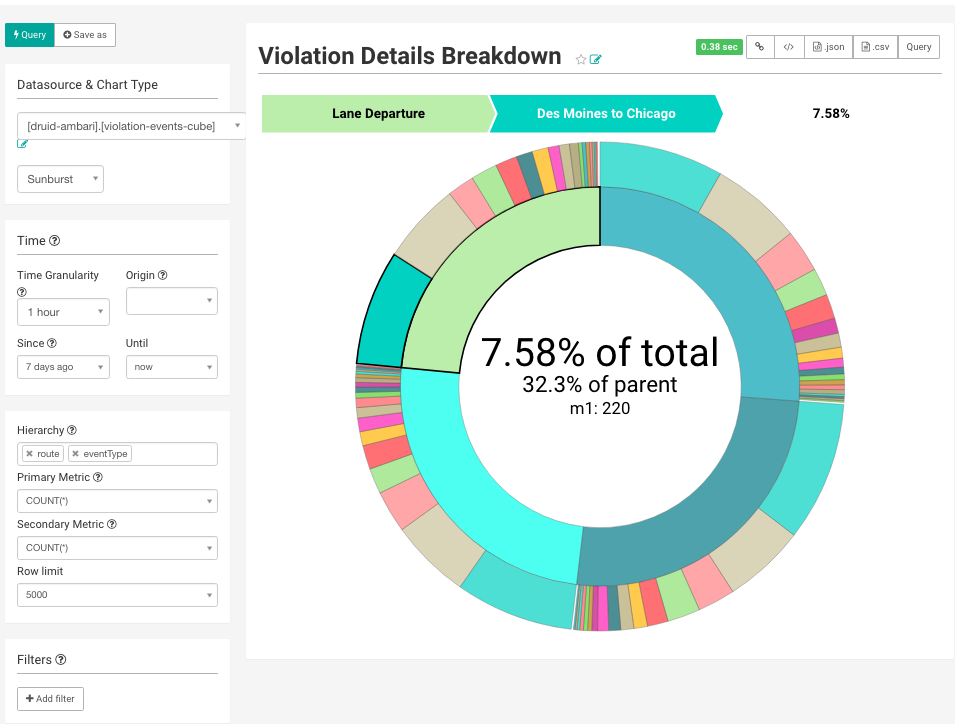
Select a Chart Type from the menu.
The following example creates a "Sunburst" visualization of rolling up multiple dimensions like route, eventType, and driver info..
Configure the chart and click Execute Query
-
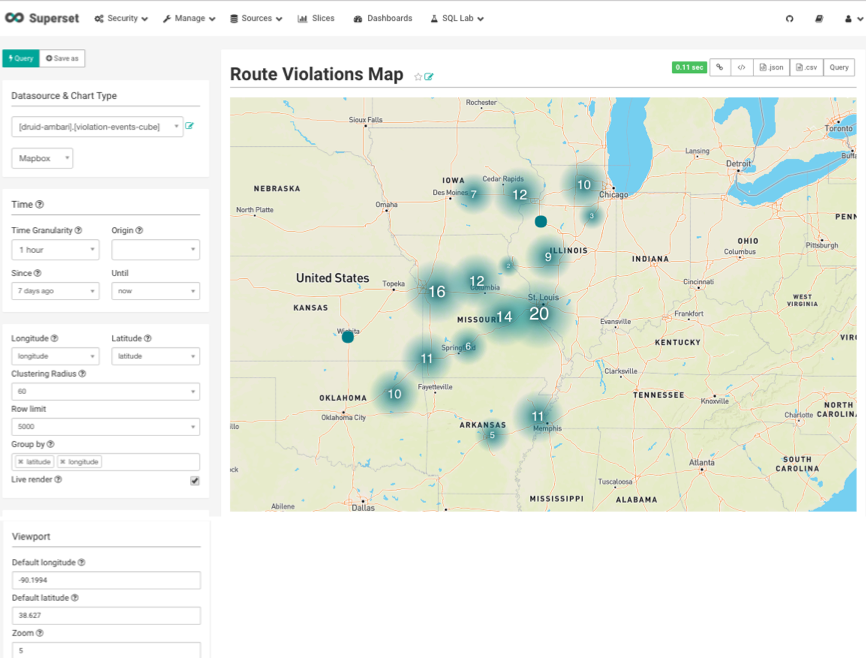
Another visualization could be integration with MapBox Here
we are mapping where violations are occurring the most based on the lat/long location
of the event
-
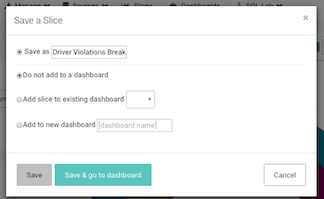
To save the slice, specify a name and name and click Save.