

Identifying Processor Performance Bottlenecks
In this scenario, we identify a custom processor that has high latency. After running the data simulator for 30 mins, we view the Overview Metrics of the topology.
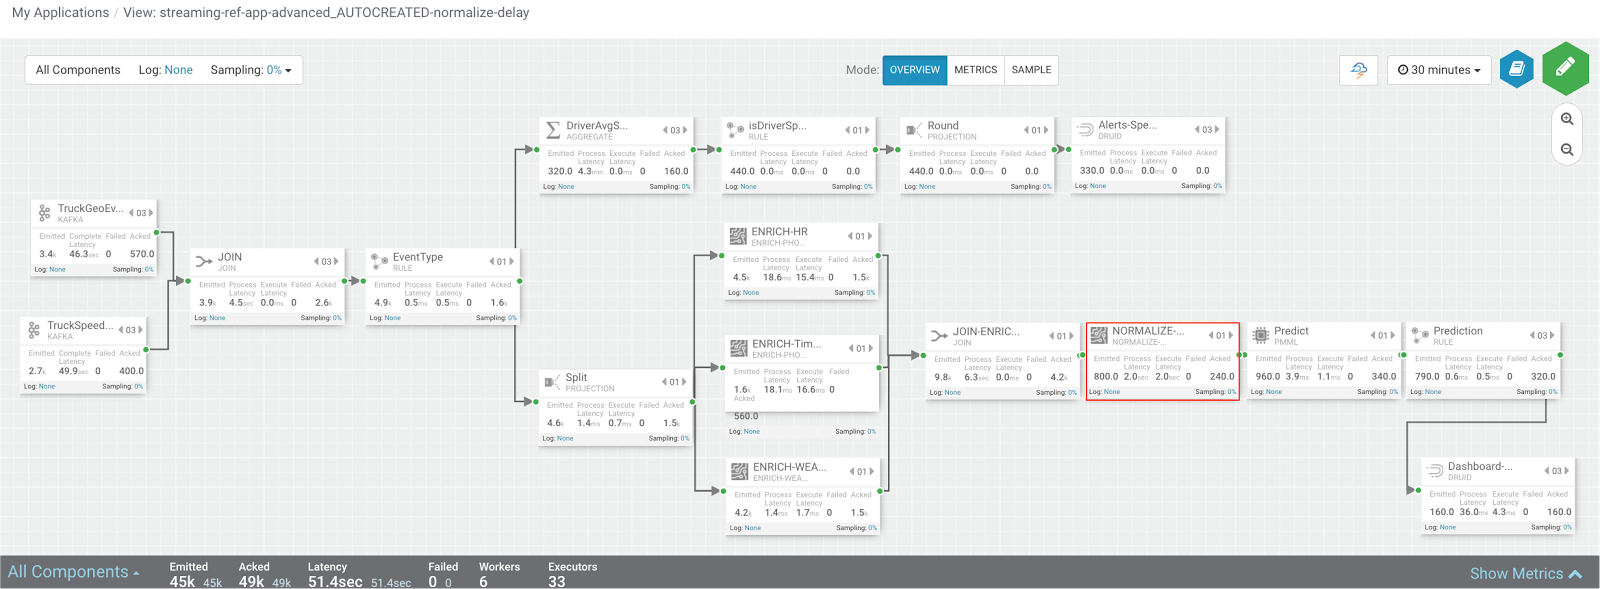
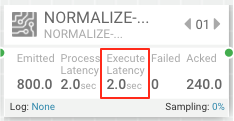
Scanning over the metrics, we see that the NORMALIZE-MODEL-FEATURES custom processor has high execute latency of 2 seconds. This means that over the last 30 minutes the average time an event spends in this component is 2 seconds.
After making changes to the custom processor to address the latench, we re-deploy the app via SAM and run the data generator for about 15 minutes and view seeing the following metrics.
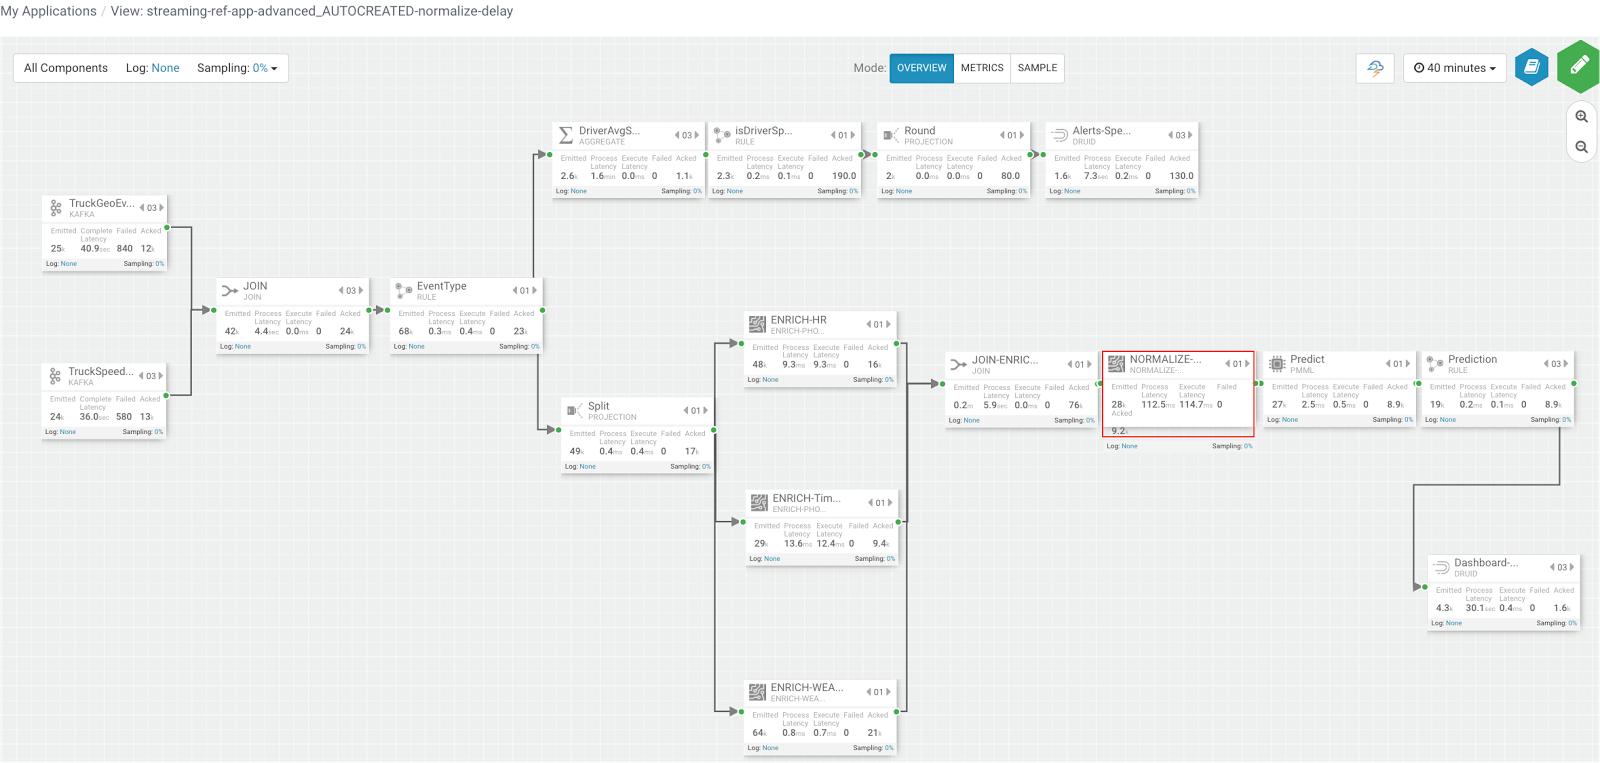
SAM’s overview and detailed metrics makes it very easy to verify if the performance changes we made had the desired effect.