

Dynamic Worker Profiling
You can request the following types of worker profile data directly from the Storm UI , without restarting the topologies:
Heap dumps
JStack output
JProfile recordings
To access this feature:
Navigate to the “Profiling and Debugging” section on the Spout/Bolt component summary page. There you will see buttons to request JStack output or generate a Heap dump:
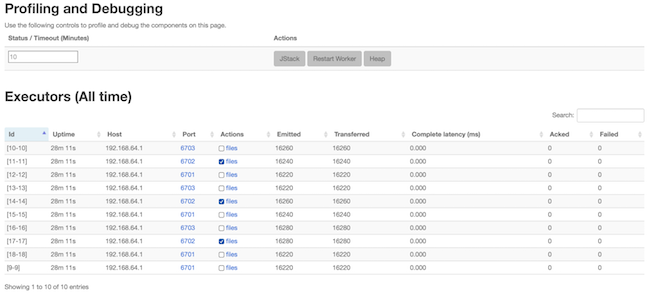
Note that you can also restart worker processes from this page.
To view output, click the “files” link under “Actions”.
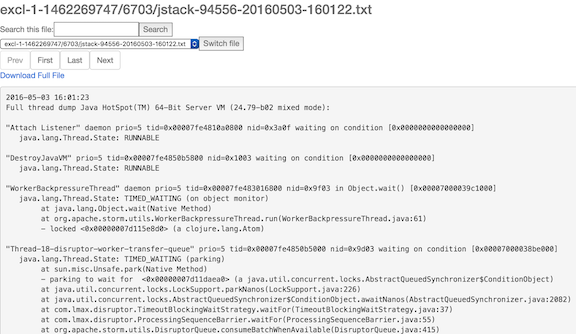
To download output for offline analysis, click the associated link under the "Actions" column on the Profiling and Debugging page, or click "Download Full File" on the output page.
See Apache JIRA STORM-1157 for more information.