

Chapter 9. Tuning an Apache Storm Topology
Because Storm topologies operate on streaming data (rather than data at rest, as in HDFS) they are sensitive to data sources. When tuning Storm topologies, consider the following questions:
What are my data sources?
At what rate do these data sources deliver messages?
What size are the messages?
What is my slowest data sink?
In a Storm cluster, most of the computational burden typically falls on the Supervisor and Worker nodes. The Nimbus node usually has a lighter load. For this reason, Hortonworks recommends that organizations save their hardware resources for the relatively burdened Supervisor and Worker nodes.
The performance of a Storm topology degrades when it cannot ingest data fast enough to keep up with the data source. The velocity of incoming streaming data changes over time. When the data flow of the source exceeds what the topology can process, memory buffers fill up. The topology suffers frequent timeouts and must replay tuples to process them.
Use the following techniques to identify and overcome poor topology performance due to mismatched data flow rates between source and application:
Identify the bottleneck.
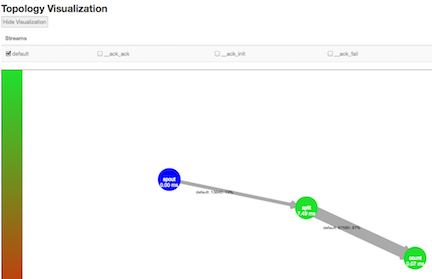
In the Storm UI, click Show Visualization to display a visual representation of your topology and find the data bottleneck in your Storm application.
Thicker lines between components denote larger data flows.
A blue component represents the the first component in the topology, such as the spout below from the WordCountTopology included with
storm-starter.The color of the other topology components indicates whether the component is exceeding cluster capacity: red components denote a data bottleneck and green components indicate components operating within capacity.
![[Note]](../common/images/admon/note.png)
Note In addition to bolts defined in your topology, Storm uses its own bolts to perform background work when a topology component acknowledges that it either succeeded or failed to process a tuple. The names of these "acker" bolts are prefixed with an underscore in the visualization, but they do not appear in the default view.
To display component-specific data about successful acknowledgements, select the
_ack_ackcheckbox. To display component-specific data about failed acknowledgements, select the_ack_failcheckbox.To verify that you have found the topology bottleneck, rewrite the
execute()method of the target bolt or spout so that it performs no operations. If the performance of the topology improves, you have found the bottleneck.Alternately, turn off each topology component, one at a time, to find the component responsible for the bottleneck.
Refer to "Performance Guidelines for Developing a Storm Topology" for several performance-related development guidelines.
Adjust topology configuration settings. For more information, see Configuring Storm Resource Usage.
Increase the parallelism for the target spout or bolt. Parallelism units are a useful conceptual tool for determining how to distribute processing tasks across a distributed application.
Hortonworks recommends using the following calculation to determine the total number of parallelism units for a topology.
(number of worker nodes in cluster * number cores per worker node) - (number of acker tasks)
Acker tasks are topology components that acknowledge a successfully processed tuple.
The following example assumes a Storm cluster with ten worker nodes, 16 CPU cores per worker node, and ten acker tasks in the topology. This Storm topology has 150 total parallelism units:
(10 * 16) - 10 = 150
Storm developers can mitigate the increased processing load associated with data persistence operations, such as writing to HDFS and generating reports, by distributing the most parallelism units to topology components that perform data persistence operations.