
This is the primary use case that was not available earlier. Users were not able to get insight into how their tasks are running. This allows the user to identify the complexity and progress of a running job.
The View Tab shows the following:
The DAG graphical view
All Vertices
Tasks per Vertex on top right of Vertex
Failed Vertex displays red to provide visual contrast with successful vertices that display green
Details of timelines are available on mouse-over on a Vertex
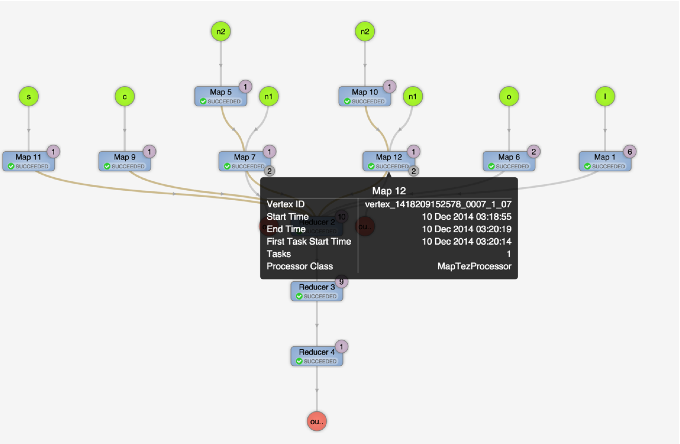
The View Tab provides a launching place to further investigate the Vertices that have failures or are taking time.
