
Default Metron Error Dashboard Section Descriptions
The Metron dashboard uses a set of default fields that you can customize.
- Total Error Messages
-
The total number of error messages received during an interim you specify
- Unique Error Messages
-
The total number of unique error messages received during the interim you have specified.
- Errors Over Time
-
A detailed message panel that displays the raw data from your search query.
- Error Source
-
When you submit a search query, the 500 most recent documents that match the query are listed in the Documents table.
- Errors by Error Type
-
A list of all of the fields associated with a selected index pattern.
- Error Type Proportion
-
Use the line chart when you want to display high density time series. This chart is useful for comparing one series with another.
- Errors by Type
-
You can use the mark down widget panel to provide explanations or instructions for the dashboard.
- List of Errors
-
You can use a metric panel to display a single large number such as the number of hits or the average of a numeric field.
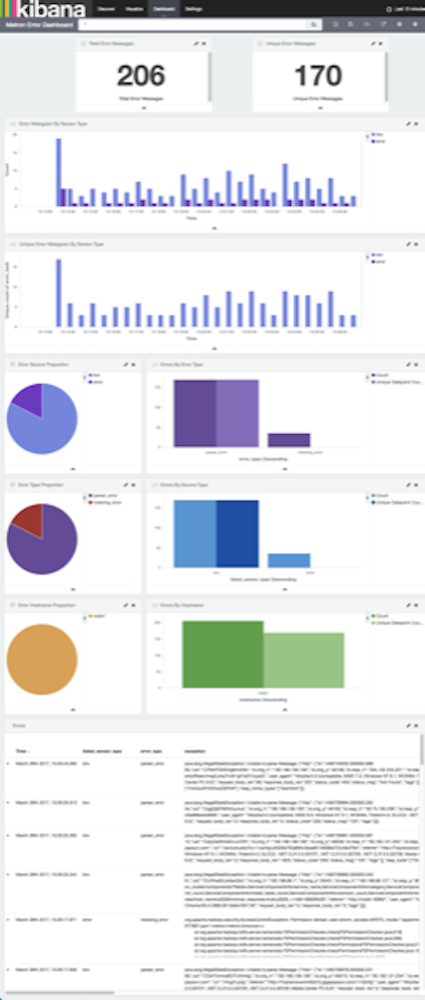
The default Error dashboard should look similar to the following: