

Viewing application details
Clicking a YARN application on the Applications page displays its details.
You can view the following details for the selected application:
- Application Attempts
- Resource Usage
- Diagnostics
- Logs
Application Attempts
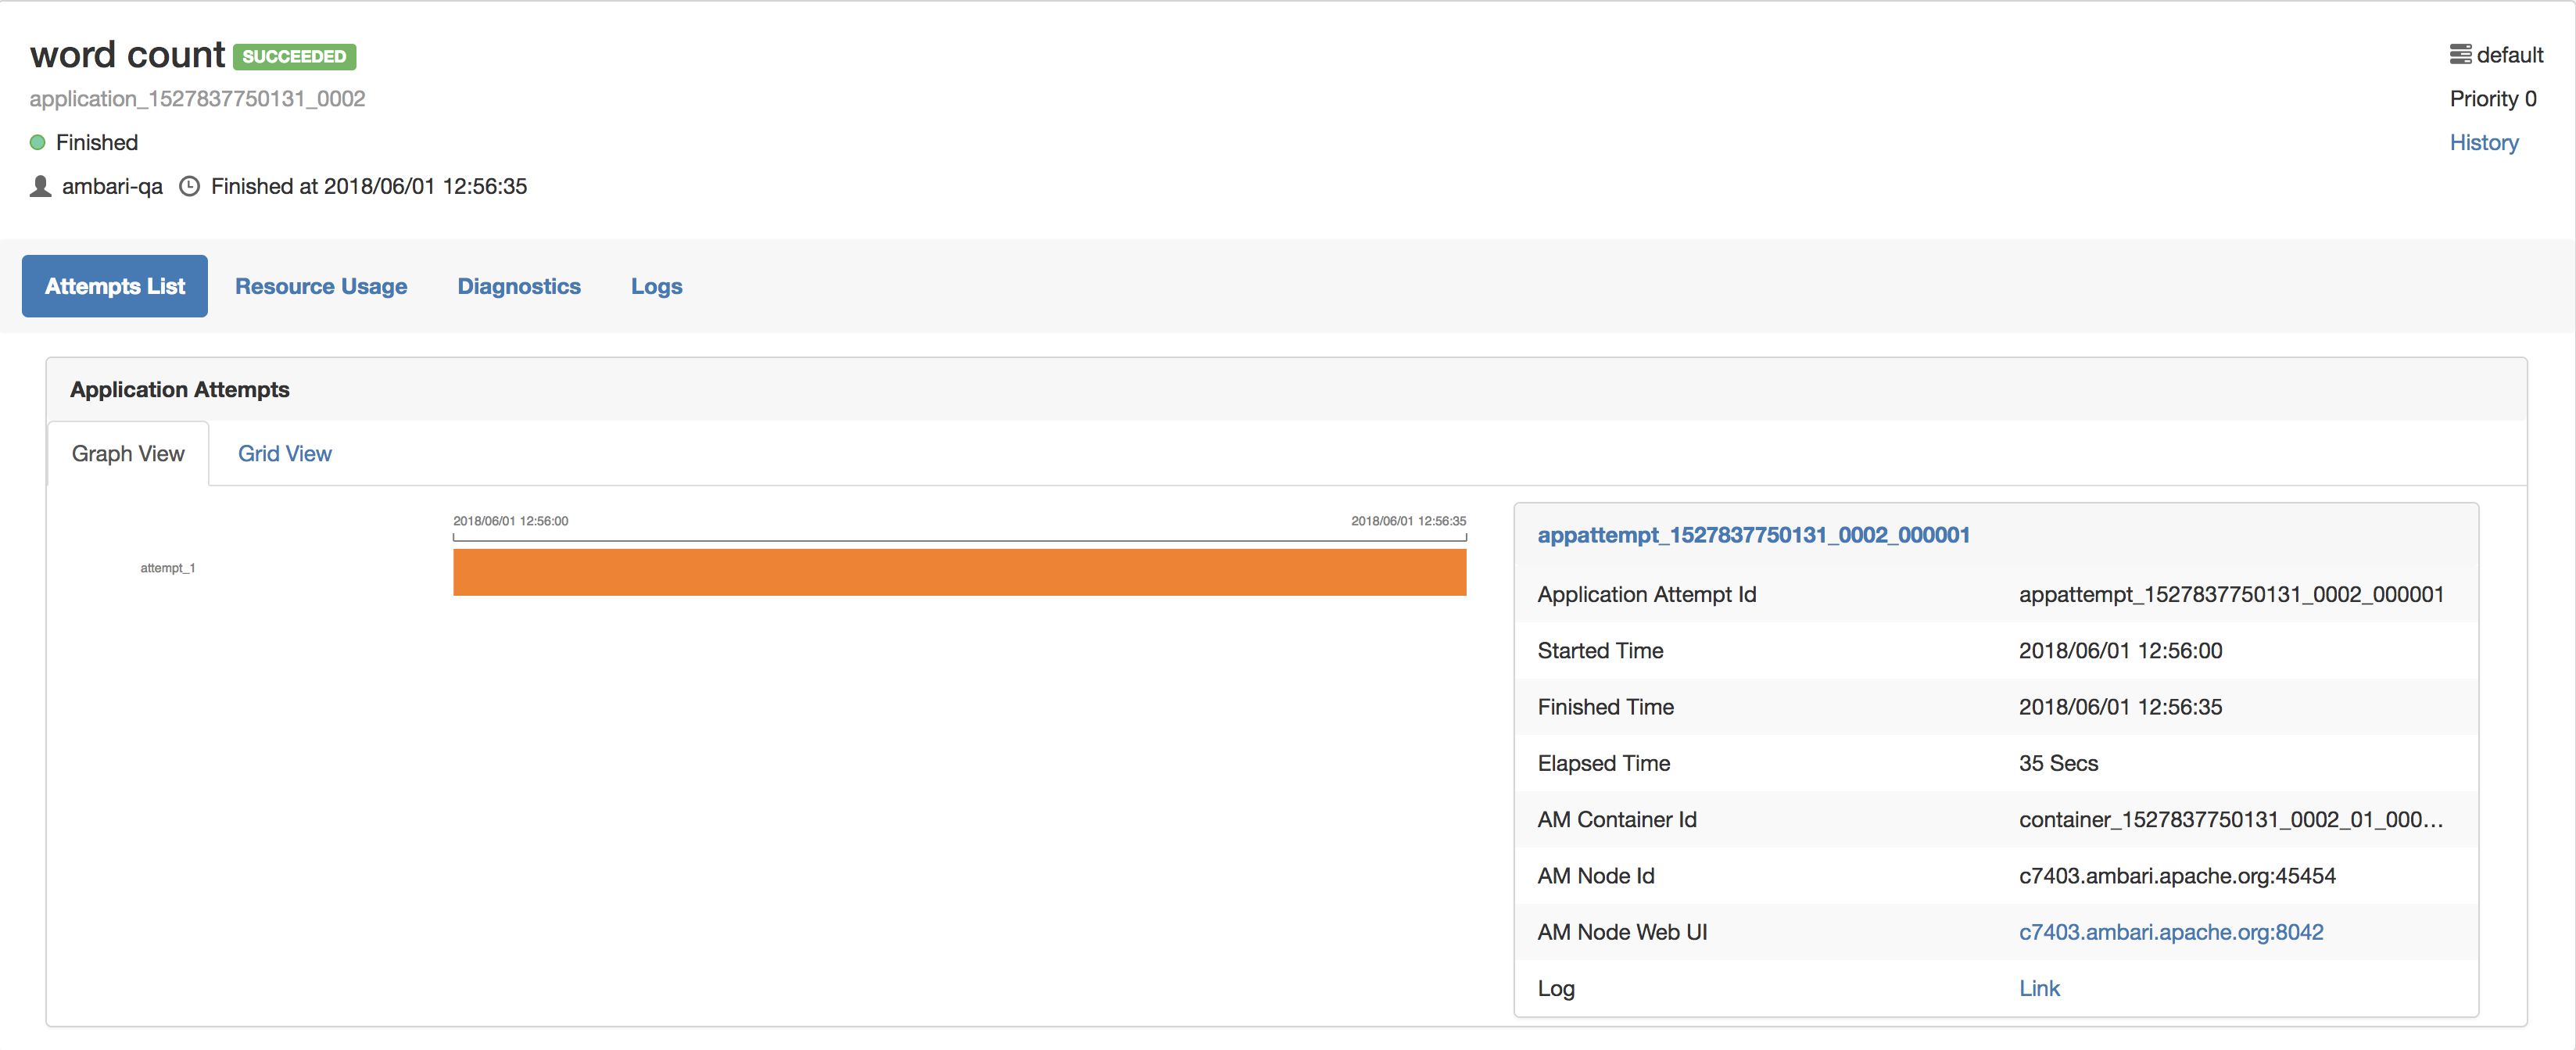
You can view the attempts in Graph View and Grid View.
- Graph View
- A graph displays the start time and finish time of the attempt. You can also find the details of the attempt such as application attempt ID, started time, finished time, elapsed time, AM Container ID, and AM Node ID in the form of a table. You can access the Node UI using the AM Node Web UI. You can also view the log by clicking on the log link.
- Grid View
- A table displays the details of the application attempts. You can find the details of the attempt such as application attempt ID, started time, finished time, elapsed time, AM Container ID, and AM Node ID. You can access the Node UI using the AM Node Web UI. You can also view the log by clicking on the log link.
Resource Usage
This tab displays the resources used by the application attempts.
Diagnostics
Use this tab to view the diagnostics details of the application attempts. You can view any outstanding resource requests, and scheduling information.
Logs
Use this tab to view logs specific to containers. Select an attempt from the dropdown list and select the specific container to view the desired logs.