

Monitoring Nodes
The Nodes page on the YARN Web User Interface enables you to view information about the cluster nodes on which the NodeManagers are running.
The Nodes page displays details under the following headers: Information, Node Status and Nodes Heatmap Chart.
Information
The Information tab displays the node details as shown in the following figure:
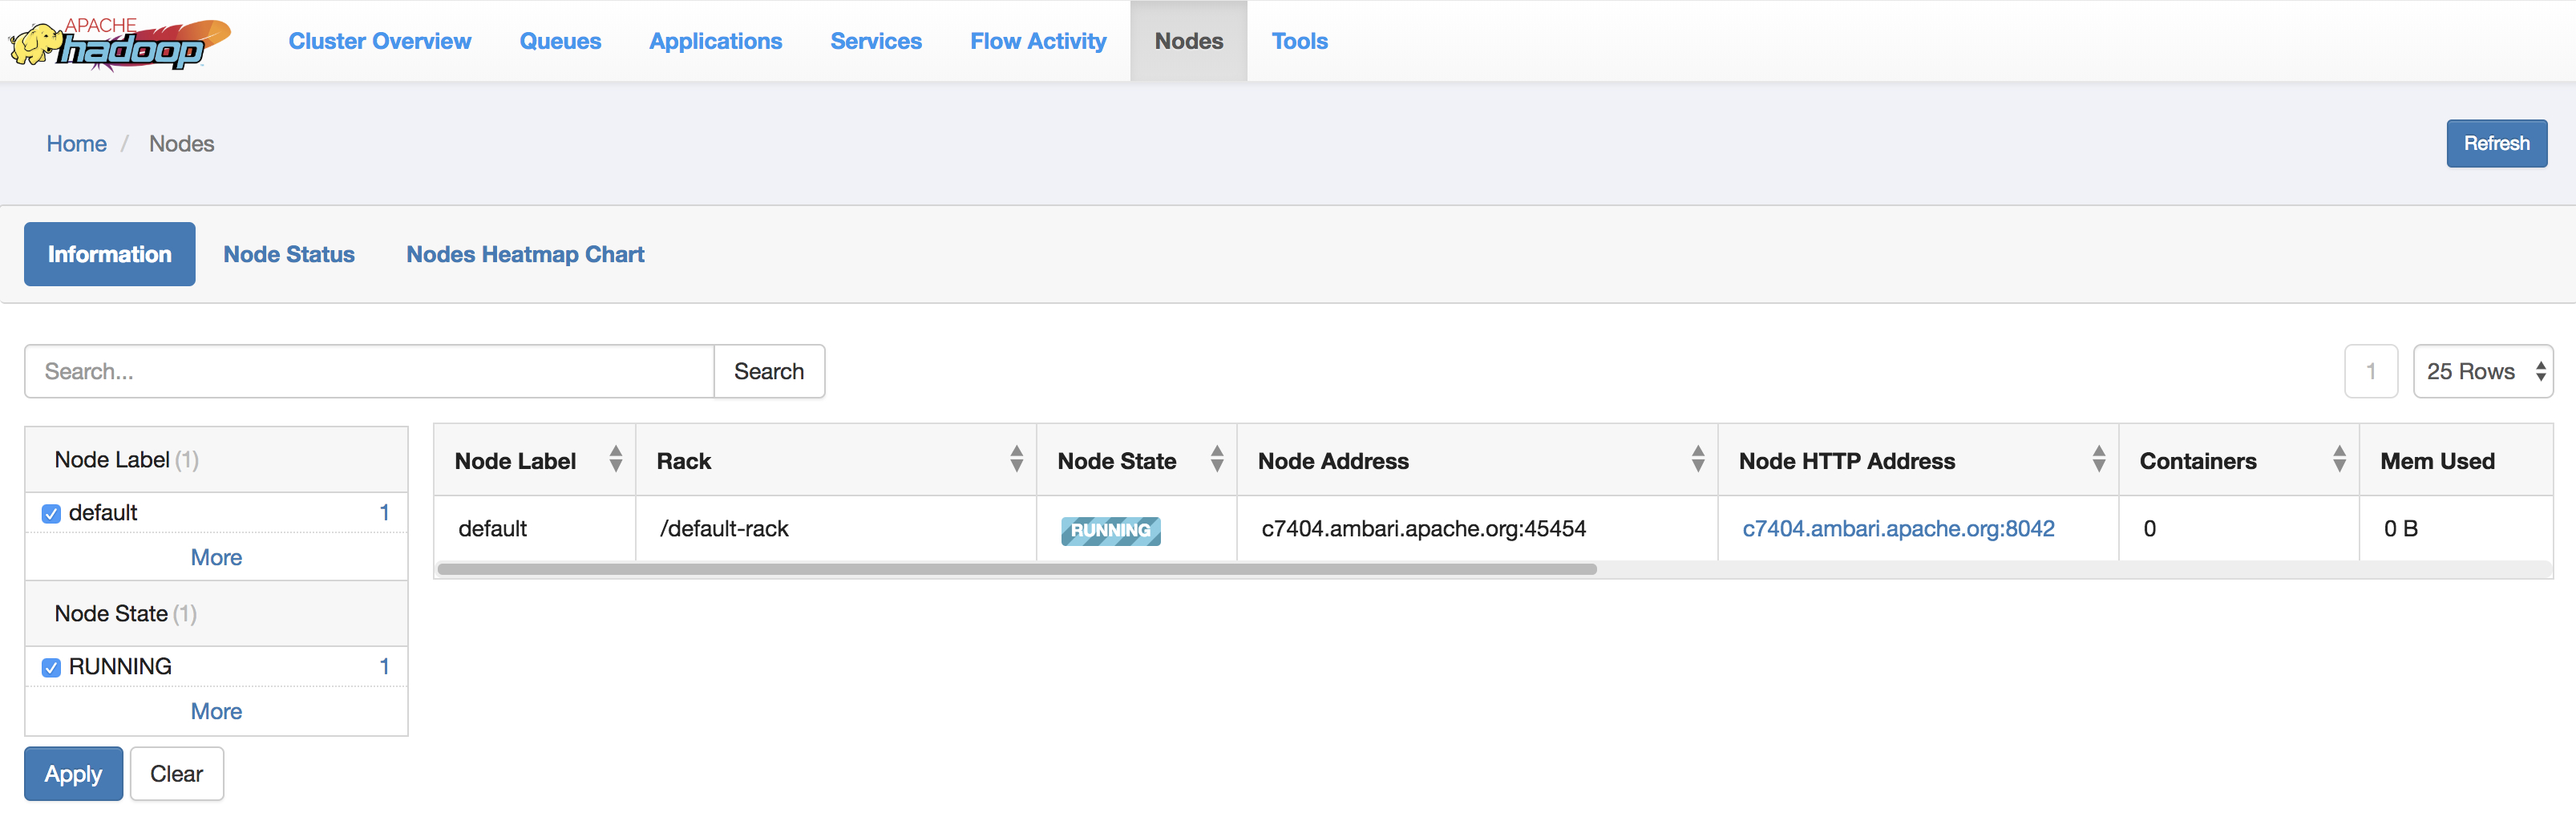
You can sort through any of the columns to view the details of the required nodes. You can also search to find the specific node labels from the entire list.
Node Manager Page
To view the Node Manager page of any node label, click the corresponding Node HTTP address. The Node Manager page displays details of a node as shown in the following figure:
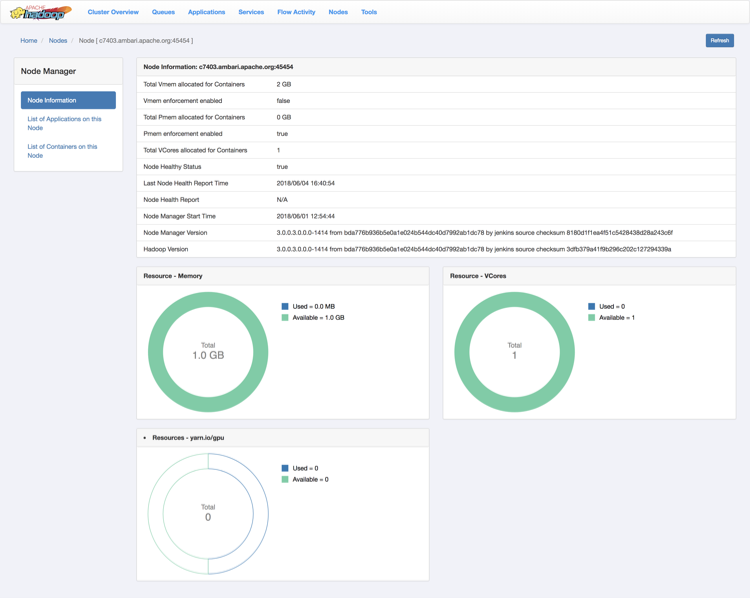
You can also view the resource usage in the following categories in a pie-chart representation:
- Memory
- VCores
- yarn-io/GPU
Node Status
This tab displays the node managers in a pictorial representation. It displays details such as the number of active nodes, number of unhealthy nodes, decommissioning nodes, and the number of decommissioned node managers.
Nodes Heatmap Chart
This tab graphically displays nodes on the basis of their usage of memory. You can enter host or rack details in the search bar to filter nodes.