
Monitoring Kafka with SMM
SMM helps address the operational, management and monitoring needs of Kafka for two distinct teams: the Platform Operations and the DevOps / AppDev teams. Each of these teams have a different lens through which they monitor Kafka and hence have different needs for monitoring Kafka.
SMM Platform Operations Persona
A Platform Operations user is less concerned about the individual performance for a given consumer and/or producer application but rather more focused on the Kafka cluster holistically and the infrastructure that it runs on. Some specific needs, requirements, and questions from a Platform Operator may include the following:
| Platform Ops Use Case | Description |
| Use Case 1 | I would like a single platform to monitor all the Kafka clusters within my organization. I want to be able to quickly switch from one Kafka cluster to another. |
| Use Case 2 | I would like to get quick current snapshot of my cluster: number of producers, number of brokers, number of topics, number of consumers. |
| Use Case 3 | Across the entire cluster, which producers are generating the most data right now? |
| Use Case 4 | Across the entire cluster, which of my consumer groups and consumer instances are falling behind with respect to reading from a topic or partition? |
| Use Case 5 | I would like to see a snapshot view of all the Kafka brokers in my cluster with information including the hosts on which the broker is running, throughput in, messages in, number of partitions, and number of replicas. |
| Use Case 6 | Are any of my brokers running hot? Which broker has the highest throughput in and out rates? |
| Use Case 7 | Which topic partitions are on a given Kafka broker? |
| Use Case 8 | Are there any skewed partitions for a broker? What is the throughput in and out for a given partition on that broker? |
| Use Case 9 | For a given broker, topic, or partition, which producers are sending data to it, and which consumer groups are consuming from it. |
| Use Case 10 | View detailed level metrics of a broker across time to see trends and patterns. |
| Use Case 11 | Whats are host metrics on the host where my broker is running? What are the other services running on my broker host? |
Let's walk through how SMM can answer these questions for a Platform Operations user:
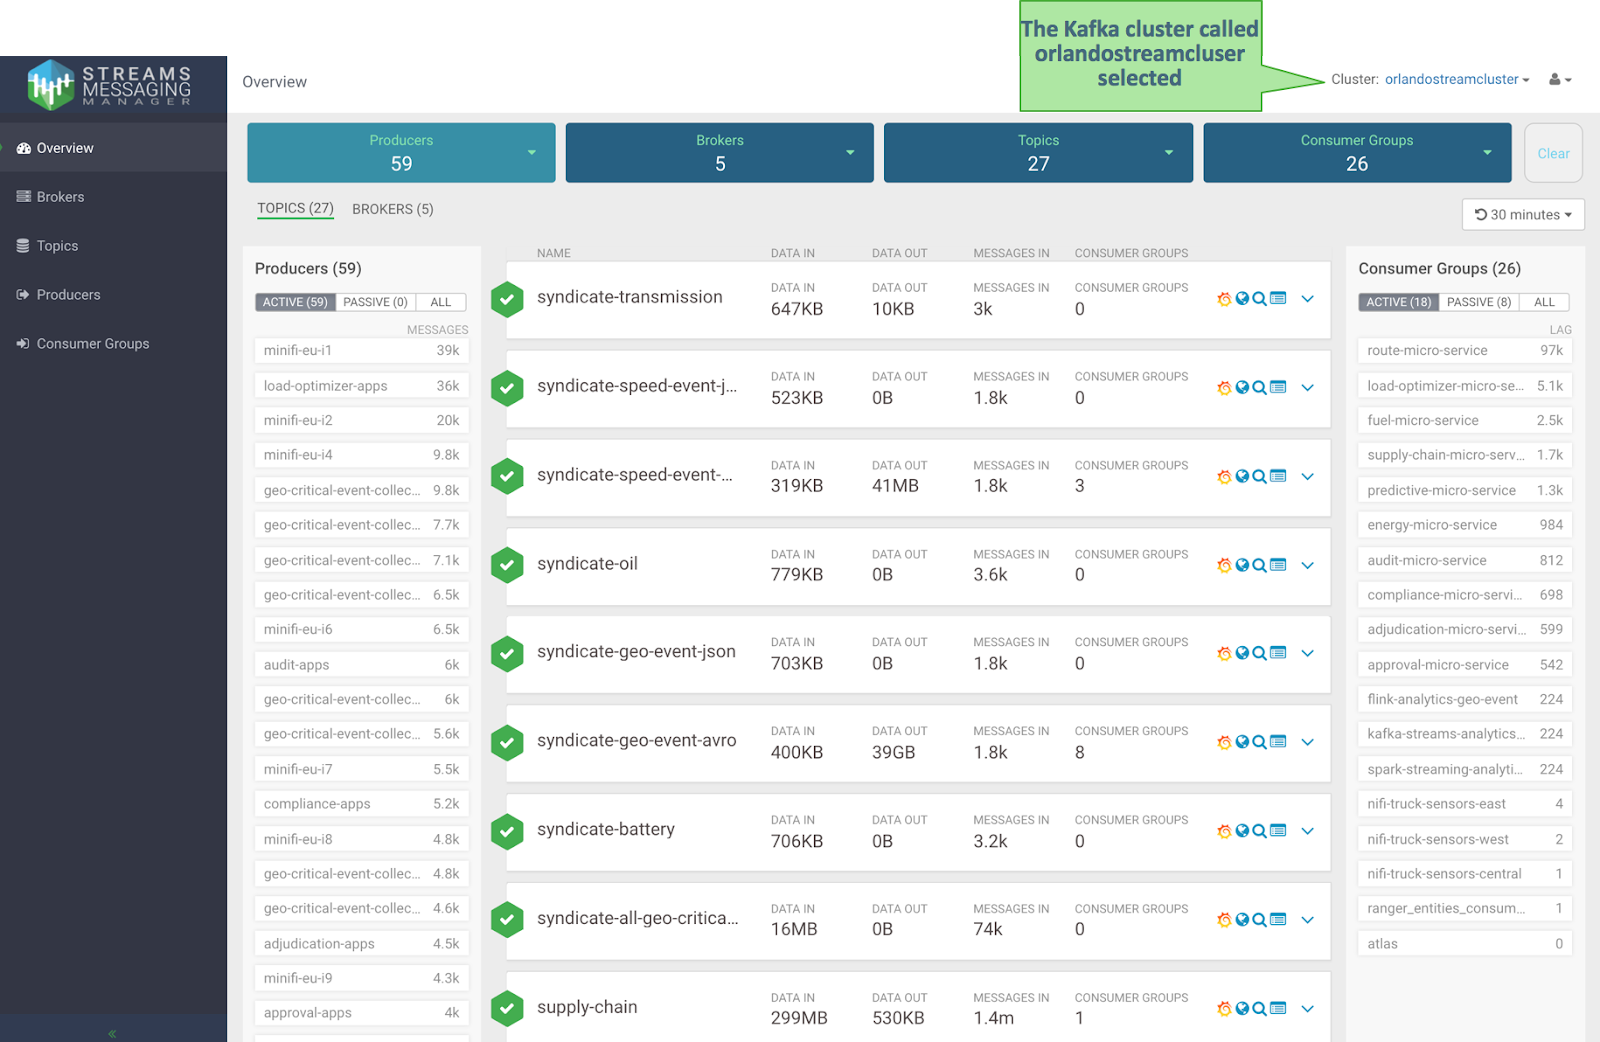
- Select the Kafka Cluster you want to monitor with SMM. This takes you to the main dashboard
view for that cluster selected. This view gives you a powerful snapshot of the workings of
the cluster displaying: total number of active and inactive producers and consumers, all
topics with summary metrics. This view also provides the ability to filter on four key
Kafka entities: producers, brokers, topics, and consumer groups. This addresses Use
Case 1 which is the ability for SMM to manage multiple Kafka clusters in the
organization and Use Case 2.
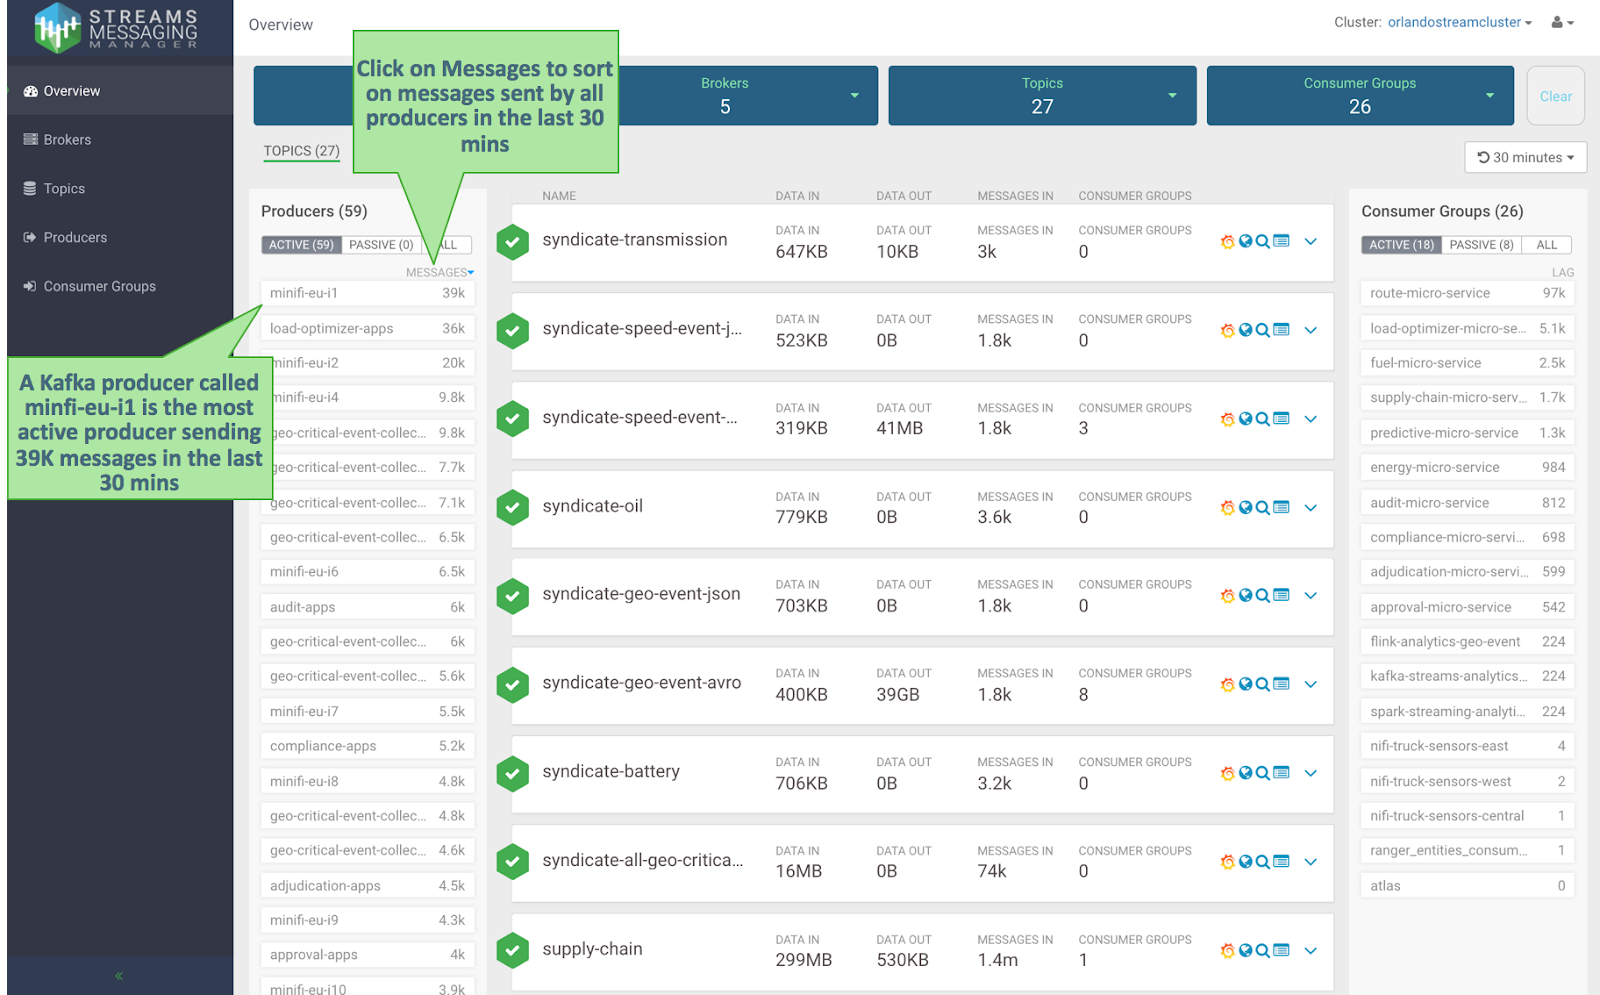
- From the Producers panel on the left hand side of the screen, select the Messages header to
sort on messages sent by all the producers in the system. We see that the Kafka
producer called minifi-eu-i1 is the most active producer, sending 39K messages in the
last 30 minutes.This addresses Use Case 3.
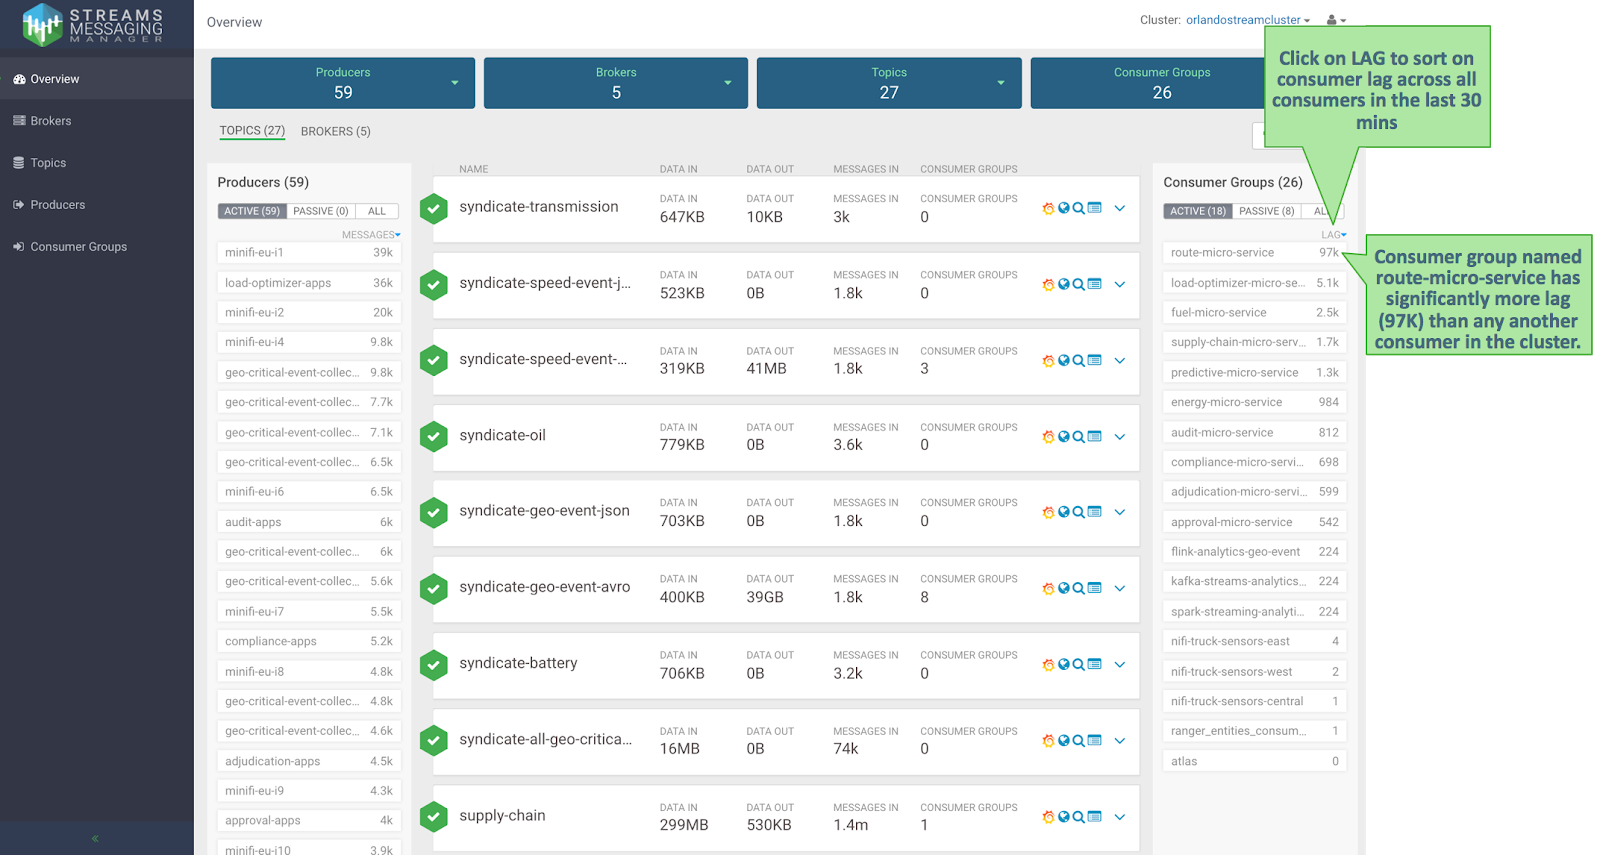
- On the Consumer Groups panel on the right hand side, select the column LAG to sort on
consumer group lag. This lag is defined as the summation of all consumer instances lag in the
consumer group. This addresses Use Case 4 because we can easily see that we have a consumer
group called micro-alert-service that has a lag of 97K over the last 30 minutes which is
significantly more than any other consumer group in the cluster.
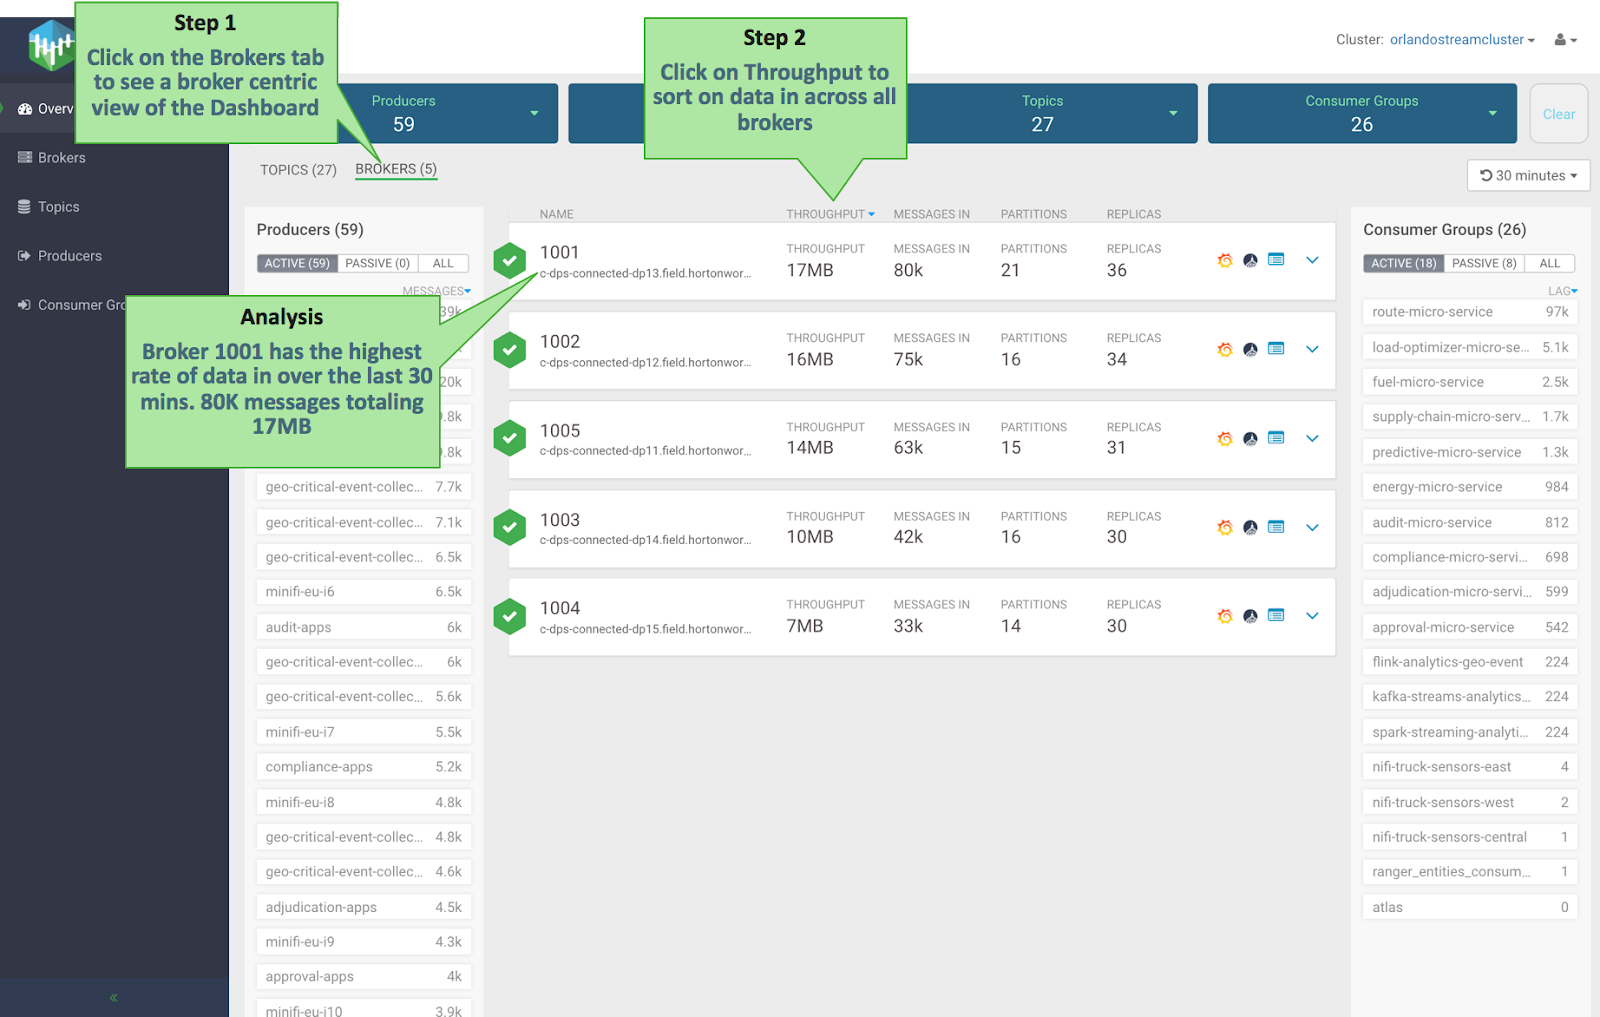
- Click the Brokers tab to see a broker centric view of the dashboard. You can view important
metrics for each broker in the cluster including: hosts the broker is running on,
throughput in, messages in, number of partitions, and number of replicas. Click the
THROUGHPUT column to sort by throughput across all brokers. You can easily see that
broker 1001 has the highest rate of data in over the last 30 minutes: 80K messages
totaling 17MB. This addresses Use Cases 5 and 6.
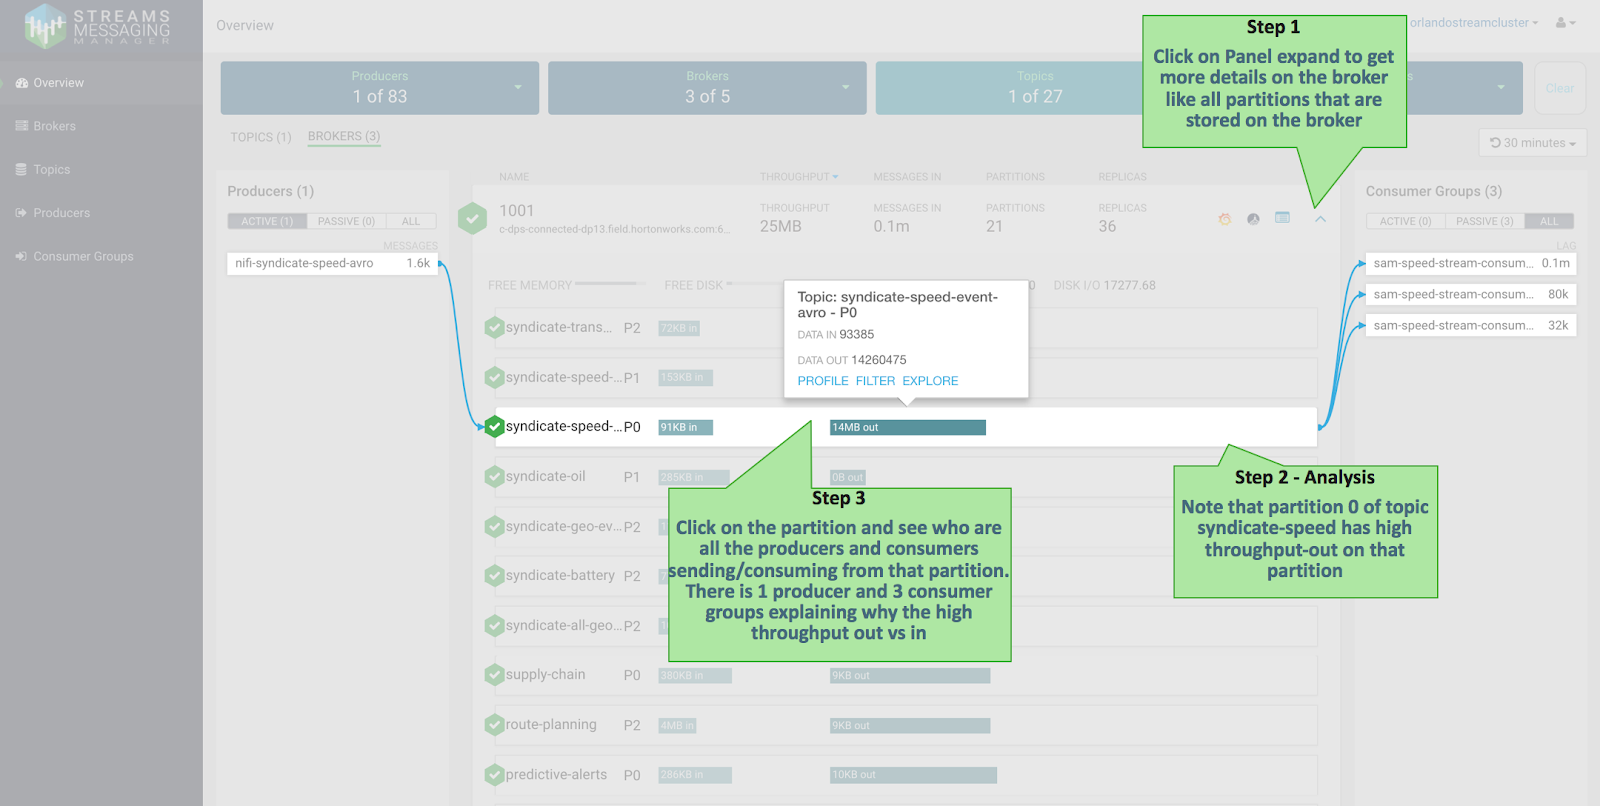
- Click on the broker panel to expand it and see more details and metrics for that broker. The
expanded panel shows all partitions for different topics that are stored on that broker.
For each partition, we see the throughput in and out relative to other partitions. We can
click on a given partition and see all the consumers currently sending data to that
broker, topic, or partition and all consumer groups consuming from that broker, topic, or
partition. We can easily see that partition 0 of topic syndicate-speed on broker 1001
has considerably higher throughput out than any of the other partitions on that broker.
By viewing how data flows in and out of that partition, we see that the partition has 1
producer but 3 consumer groups which explains the high throughput out relative to the
throughput in. This addresses Use Case 7, 8 and 9.
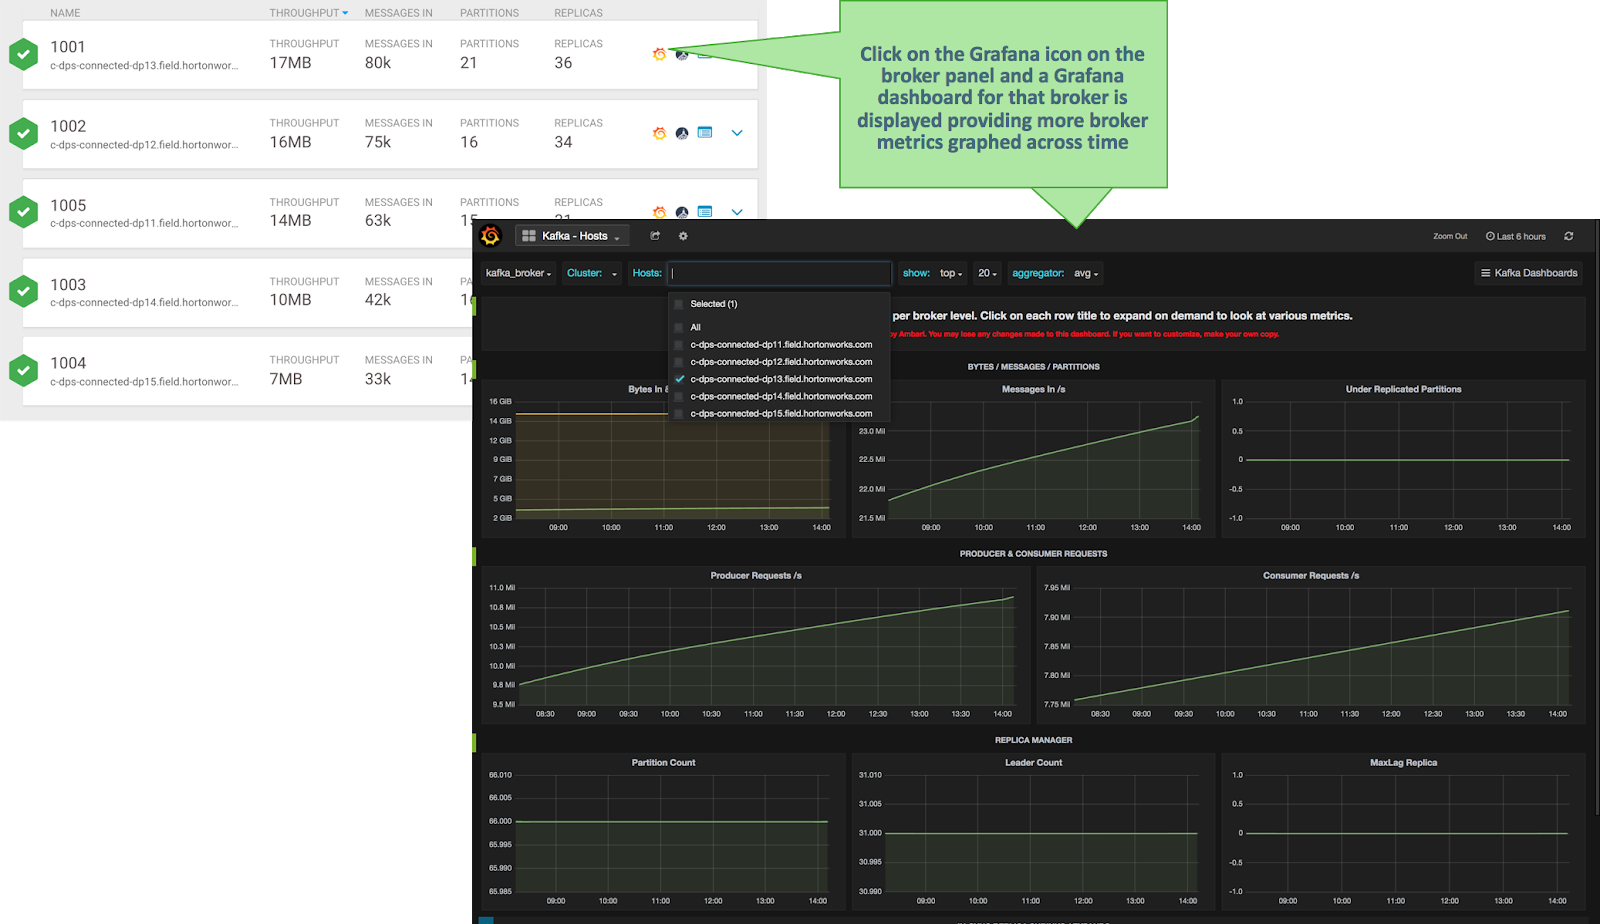
- Click the Grafana icon on the broker panel to see more detailed metrics within Grafana for
that broker. This addresses Use Case 10.
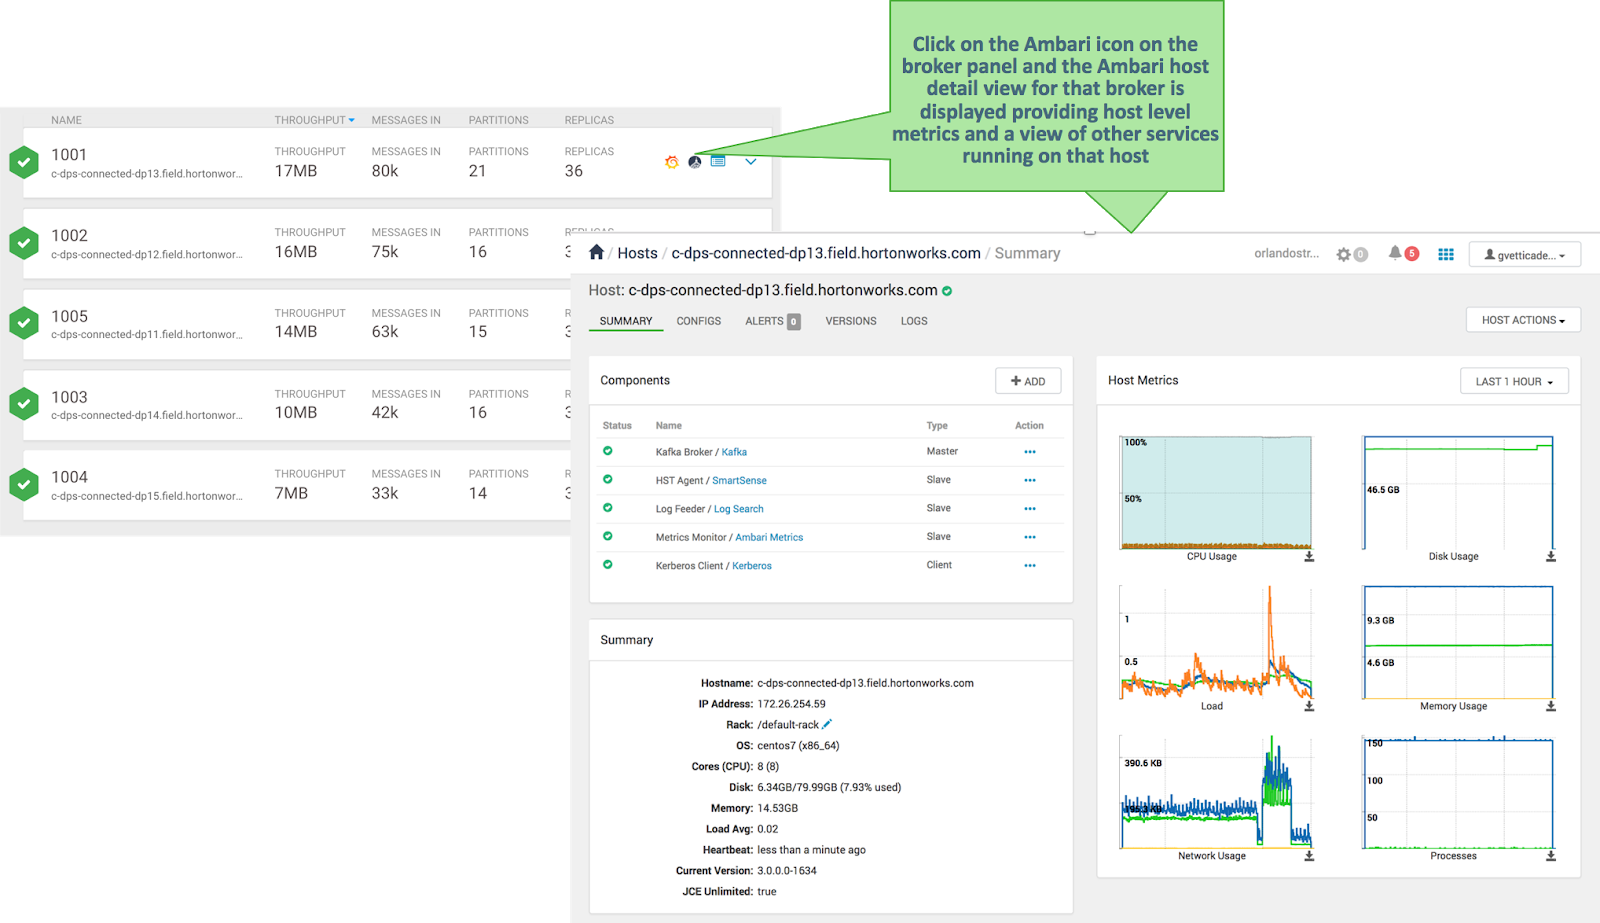
- Click the Ambari icon on the broker panel and view Broker Host detail metrics. This
addresses Use Case 11.
DevOps and Application Developer Persona
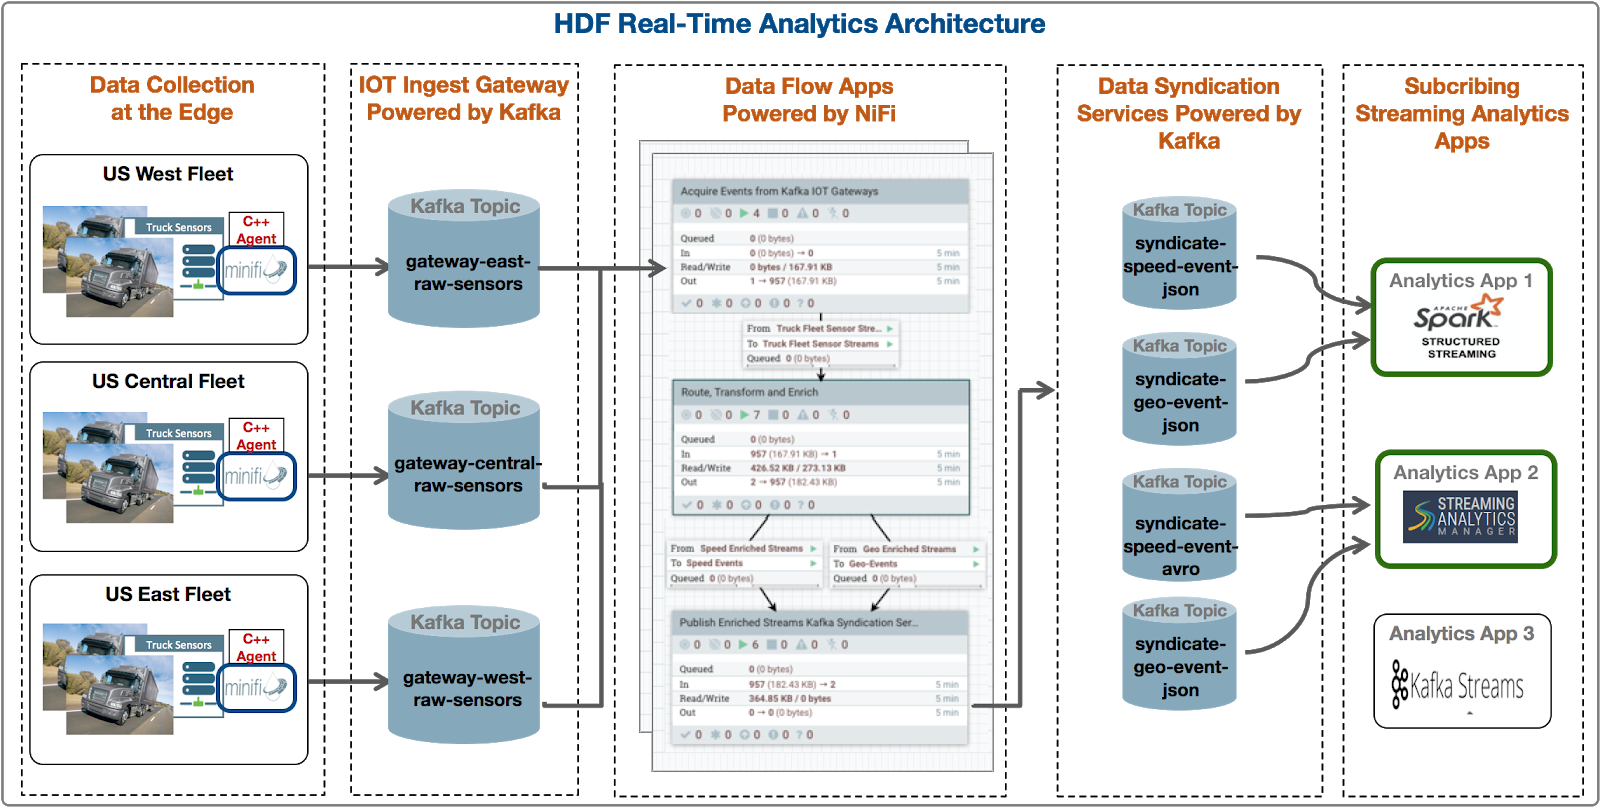
Unlike a Platform Operations persona, the DevOps / AppDev persona is most interested in the entities (producers, topics, consumers) specific to their application. So let's assume we are on the DevOps team responsible for monitoring the Trucking Reference Application that is deployed in production, based on this architecture.
Some specific needs/requirements/questions as a DevOps member for the trucking ref app might be the following.
| DevOps/App Dev Use Case | Description |
| Use Case 1 | I want to quickly find all entities (producer, consumers, topics) associated with my application. |
| Use Case 2 | For all the topics associated with my applications, I want to easily see important metrics such as throughput in/out, number of consumer groups, number of messages across a period of time. |
| Use Case 3 | Which of my topics is being sent the most amount of data over a certain period of time? In other words, which regional/geo truck fleet is sending the most amount of data? |
| Use Case 4 | For a given Kafka topic that is part of my application, which are all the connected producers sending data? In other words, which truck fleets are sending data to a gateway topic? |
| Use Case 5 | Are there any topics who have producers but no consumer groups connected to it? In other words, are trucks sending data to a topic but no analytics or processing is being done? |
| Use Case 6 | For a given topic, how many partitions are there? Where are the partitions located? How is data distributed across the partitions? Are there any partition skews? |
| Use Case 7 | Which consumer groups are connected to a given topic and are actively consuming data from it? |
| Use Case 8 | For a given topic, I want to be able to explore data in the topic searching using offsets and/or partition. |
| Use Case 9 | I want to find Metadata and Lineage of the Topic across producers, consumers, and multiple Kafka hops. |
Let's walk through how SMM can answer these questions for a DevOps/App Dev user.
- Select the Topic filter and select all the IoT gateway topics by searching for all topics
that start with gateway.
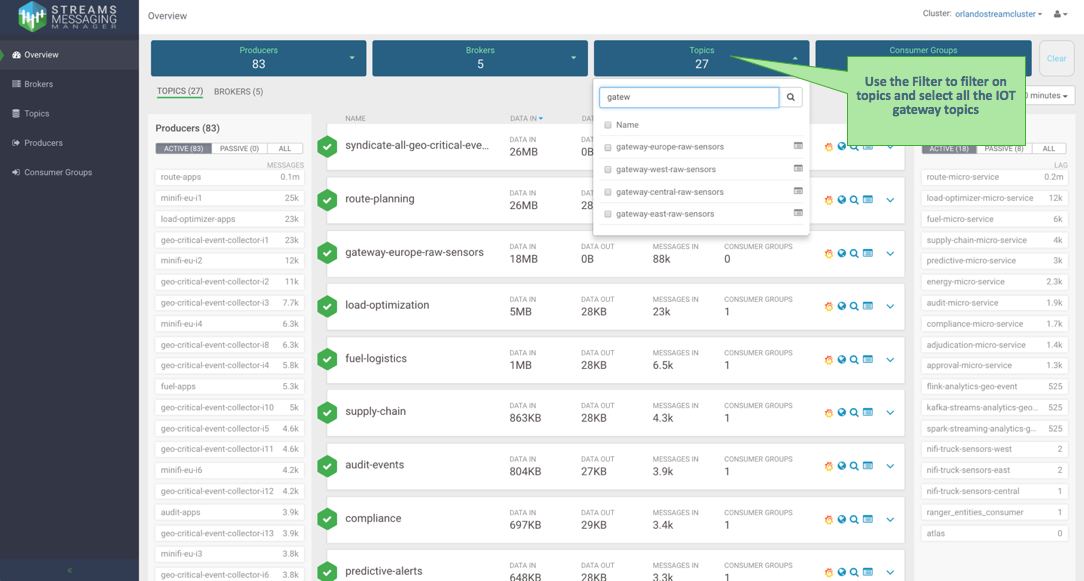
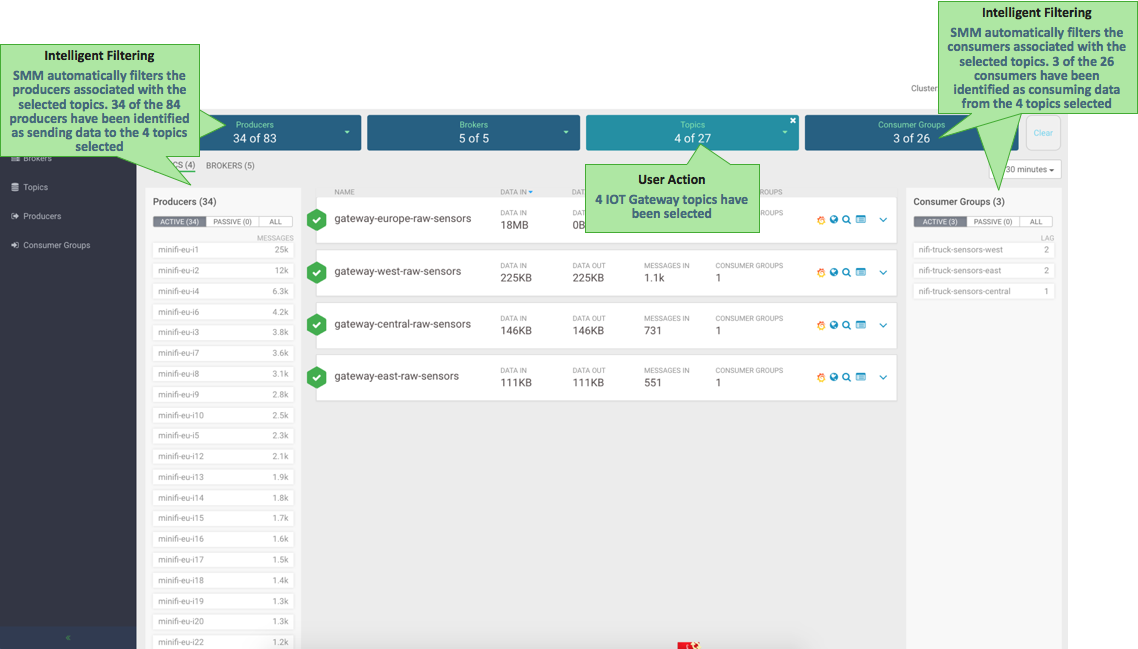
- When the filter is applied, SMM provides intelligent filtering by showing only the producers
that are sending data to the 4 gateway topics and the consumer groups only consuming data
from those topics. So, when the user selects the 4 gateway topics, SMM displays 34 of
the 83 producers sending data to those topics and 3 of the 26 consumer groups consuming
data from it. Key metrics for the selected topics are shown including data-in and out,
number of messages, number of consumer groups, etc. This addresses Use Cases 1 and 2.
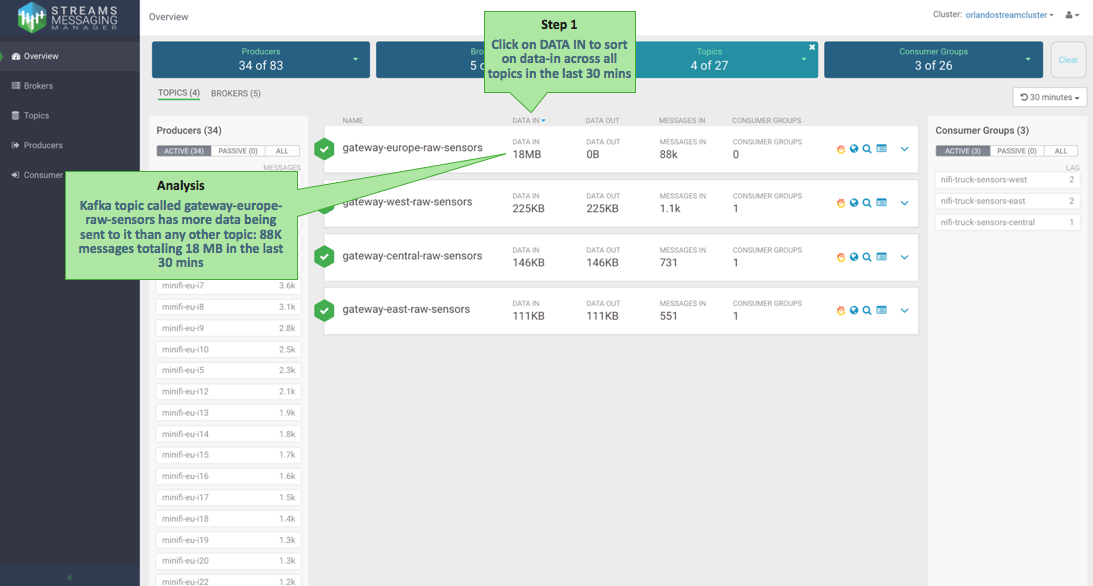
- Click DATA IN to sort on data throughput-in across all topics. We see that
gateway-europe-raw-sensor has significantly more data coming in than any other topic: 18
MB totaling 88K in the last 30 minutes. This addresses Use Case 3.
- Expand the topic panel for gateway-europe-raw-sensor to get more details for the topic,
including like partition layout. Click the topic to see which producers are sending data
to each partition of that topic. We see that all the producers are trucks from the EU
fleet. Also note that all five partitions for that topic have 0B going out and we see
no data flowing from the topic to any consumer group. This could be worth investigating
to identify why a topic with the most amount of producers has no consumers. This
addresses Use Cases 4 and 5.

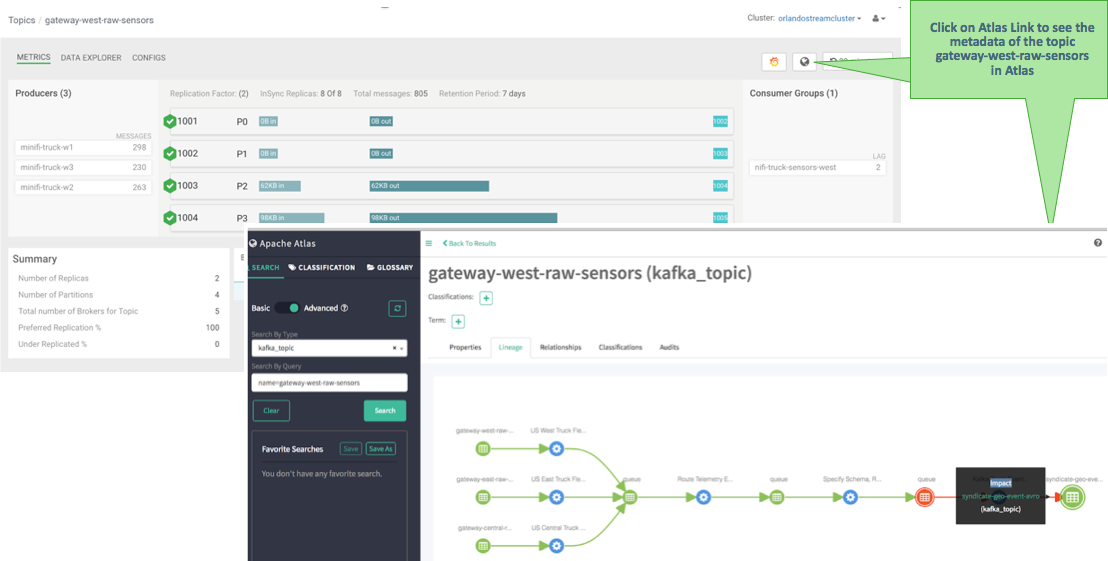
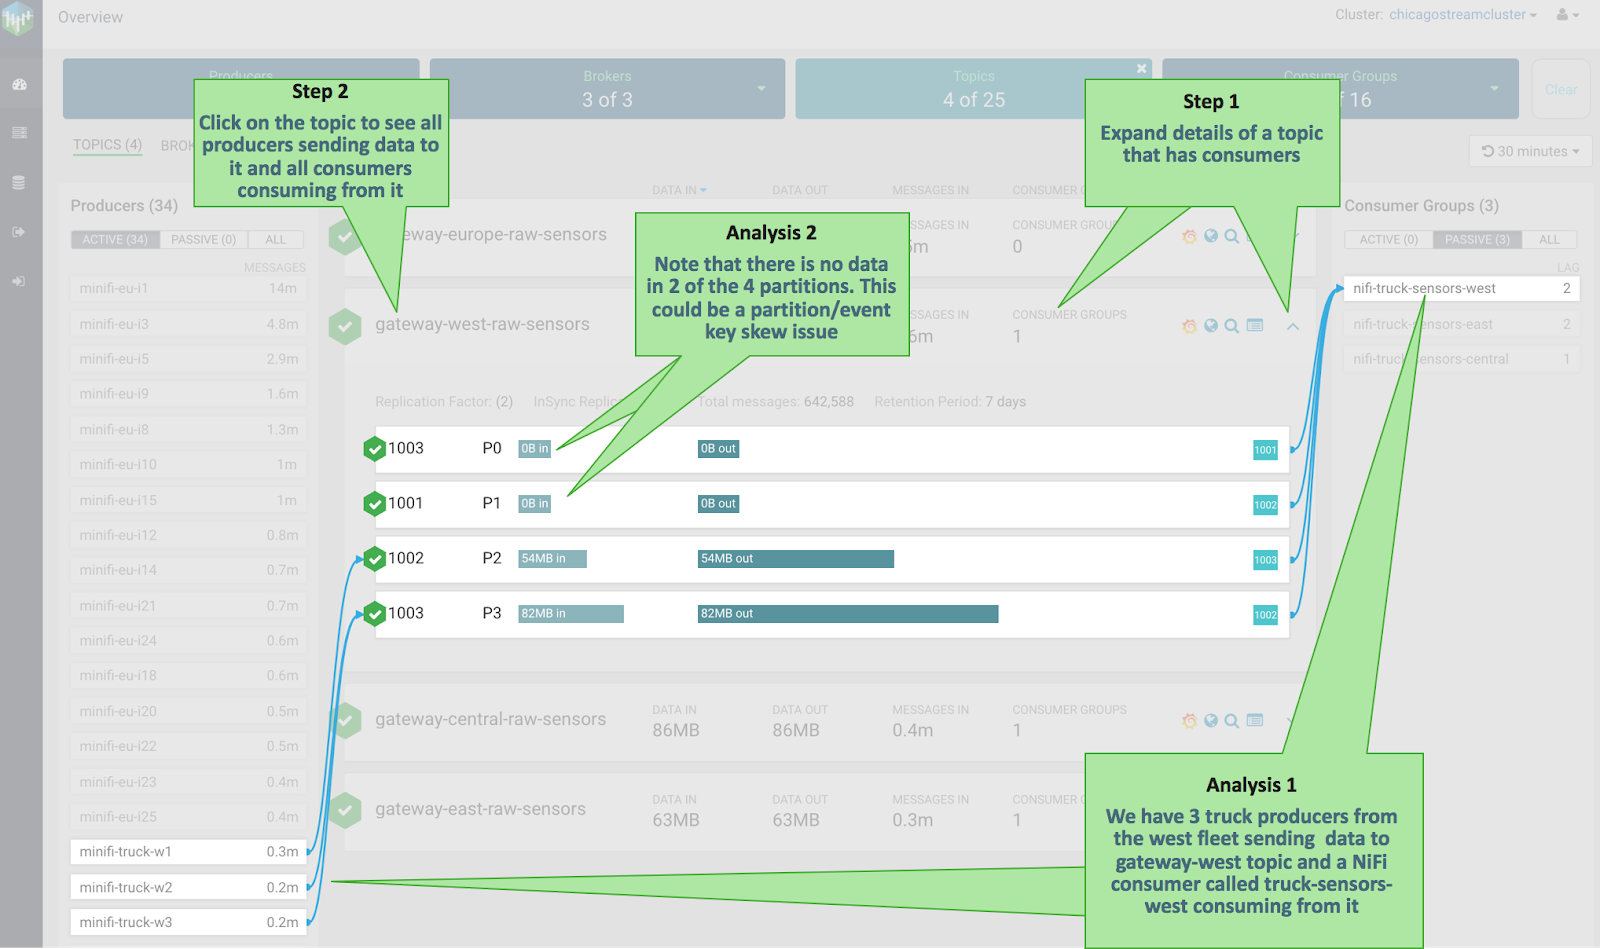
- Click another topic called gateway-west-raw-sensors that has consumers. This topic has three
producers sending data to it and a NiFi consumer consuming from it. We also see that two
of the four partitions for this topic have no data in them, which indicates that there is
partition skew issue. This addresses Use Cases 6 and 7.
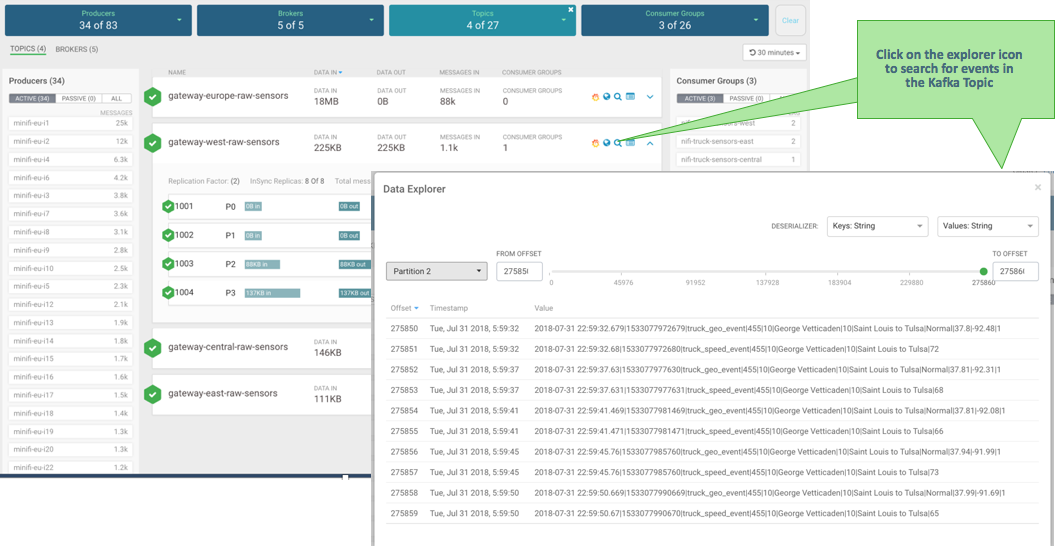
- Click the explorer/magnifying glass icon to search for events in the selected Kafka topic.
This addresses Use Case 8.
- Click the Atlas icon to see the metadata and lineage of the Kafka topic in Atlas. This
addresses Use Case 9.