

Anatomy of a Processor
NiFi provides a significant amount of information about each Processor on the canvas. The following diagram shows the anatomy of a Processor:
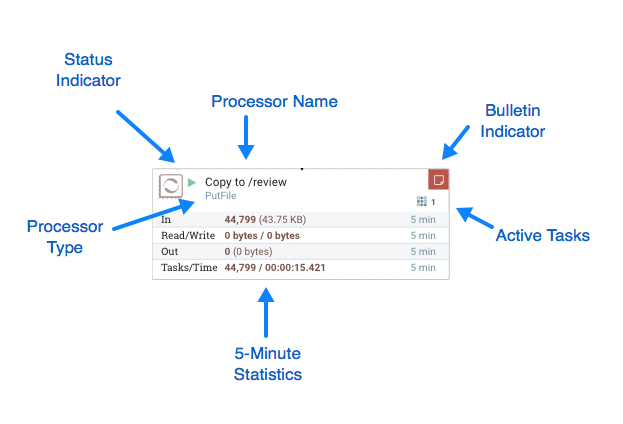
The image outlines the following elements:
Processor Type: NiFi provides several different types of Processors in order to allow for a wide range of tasks to be performed. Each type of Processor is designed to perform one specific task. The Processor type (PutFile, in this example) describes the task that this Processor performs. In this case, the Processor writes a FlowFile to disk - or "Puts" a FlowFile to a File.
Bulletin Indicator: When a Processor logs that some event has occurred, it generates a Bulletin to notify those who are monitoring NiFi via the User Interface. The DFM is able to configure which bulletins should be displayed in the User Interface by updating the "Bulletin level" field in the "Settings" tab of the Processor configuration dialog. The default value is
WARN, which means that only warnings and errors will be displayed in the UI. This icon is not present unless a Bulletin exists for this Processor. When it is present, hovering over the icon with the mouse will provide a tooltip explaining the message provided by the Processor as well as the Bulletin level. If the instance of NiFi is clustered, it will also show the Node that emitted the Bulletin. Bulletins automatically expire after five minutes.Status Indicator: Shows the current Status of the Processor. The following indicators are possible:
 Running: The Processor is
currently running.
Running: The Processor is
currently running. Stopped: The Processor is valid
and enabled but is not running.
Stopped: The Processor is valid
and enabled but is not running. Invalid: The Processor is
enabled but is not currently valid and cannot be started. Hovering over this icon
will provide a tooltip indicating why the Processor is not valid.
Invalid: The Processor is
enabled but is not currently valid and cannot be started. Hovering over this icon
will provide a tooltip indicating why the Processor is not valid. Disabled: The Processor is not
running and cannot be started until it has been enabled. This status does not
indicate whether or not the Processor is valid.
Disabled: The Processor is not
running and cannot be started until it has been enabled. This status does not
indicate whether or not the Processor is valid.
Processor Name: This is the user-defined name of the Processor. By default, the name of the Processor is the same as the Processor Type. In the example, this value is "Copy to /review".
Active Tasks: The number of tasks that this Processor is currently executing. This number is constrained by the "Concurrent tasks" setting in the "Scheduling" tab of the Processor configuration dialog. Here, we can see that the Processor is currently performing two tasks. If the NiFi instance is clustered, this value represents the number of tasks that are currently executing across all nodes in the cluster.
5-Minute Statistics: The Processor shows several different statistics in tabular form. Each of these statistics represents the amount of work that has been performed in the past five minutes. If the NiFi instance is clustered, these values indicate how much work has been done by all of the Nodes combined in the past five minutes. These metrics are:
In: The amount of data that the Processor has pulled from the queues of its incoming Connections. This value is represented as <count> / <size> where <count> is the number of FlowFiles that have been pulled from the queues and <size> is the total size of those FlowFiles' content. In this example, the Processor has pulled 884 FlowFiles from the input queues, for a total of 8.85 megabytes (MB).
Read/Write: The total size of the FlowFile content that the Processor has read from disk and written to disk. This provides valuable information about the I/O performance that this Processor requires. Some Processors may only read the data without writing anything while some will not read the data but will only write data. Others will neither read nor write data, and some Processors will both read and write data. In this example, we see that in the past five minutes, this Processor has read 4.7 MB of the FlowFile content and has written 4.7 MB as well. This is what we would expect, since this Processor simply copies the contents of a FlowFile to disk. Note, however, that this is not the same as the amount of data that it pulled from its input queues. This is because some of the files that it pulled from the input queues already exist in the output directory, and the Processor is configured to route FlowFiles to failure when this occurs. Therefore, for those files which already existed in the output directory, data was neither read nor written to disk.
Out: The amount of data that the Processor has transferred to its outbound Connections. This does not include FlowFiles that the Processor removes itself, or FlowFiles that are routed to connections that are auto-terminated. Like the "In" metric above, this value is represented as <count> / <size> where <count> is the number of FlowFiles that have been transferred to outbound Connections and <size> is the total size of those FlowFiles' content. In this example, all of the Relationships are configured to be auto-terminated, so no FlowFiles are reported as having been transferred Out.
Tasks/Time: The number of times that this Processor has been triggered to run in the past 5 minutes, and the amount of time taken to perform those tasks. The format of the time is <hour>:<minute>:<second>. Note that the amount of time taken can exceed five minutes, because many tasks can be executed in parallel. For instance, if the Processor is scheduled to run with 60 Concurrent tasks, and each of those tasks takes one second to complete, it is possible that all 60 tasks will be completed in a single second. However, in this case we will see the Time metric showing that it took 60 seconds, instead of 1 second. This time can be thought of as "System Time," or said another way, this value is 60 seconds because that's the amount of time it would have taken to perform the action if only a single concurrent task were used.