To add a new data source, you must create a parser that transforms the data source
data into JSON messages suitable for downstream enrichment and indexing by HCP. Although HCP
supports both Java and general-purpose parsers, you can learn the general process of creating
parsers by viewing an example using the general-purpose parser Grok.
-
Determine the format of the new data source’s log entries, so you can parse them:
-
Use ssh to access the host for the new data source.
-
View the different log files and determine which to parse:
sudo su -
cd /var/log/$NEW_DATASOURCE
ls
The file you want is typically the access.log, but your
data source might use a different name.
-
Generate entries for the log that needs to be parsed so that you can see the
format of the entries:
timestamp | time elapsed | remotehost | code/status | bytes | method | URL rfc931 peerstatus/peerhost | type
-
Create a Grok statement file that defines the Grok expression for the log type you
identified in Step 1.
 | Important |
|---|
You must include timestamp in the Grok
expression to ensure that the system uses the event time rather than the system
time. |
Refer to the Grok documentation for additional details.
- Launch the HCP Management module from
$METRON_MANAGEMENT_UI_HOST:4200, or
follow these steps:
-
From the Ambari Dashboard, click Metron.
-
Select the Quick Links.
-
Select Metron Management UI.
-
Launch the Management UI.
-
Under Operations, click Sensors.
-
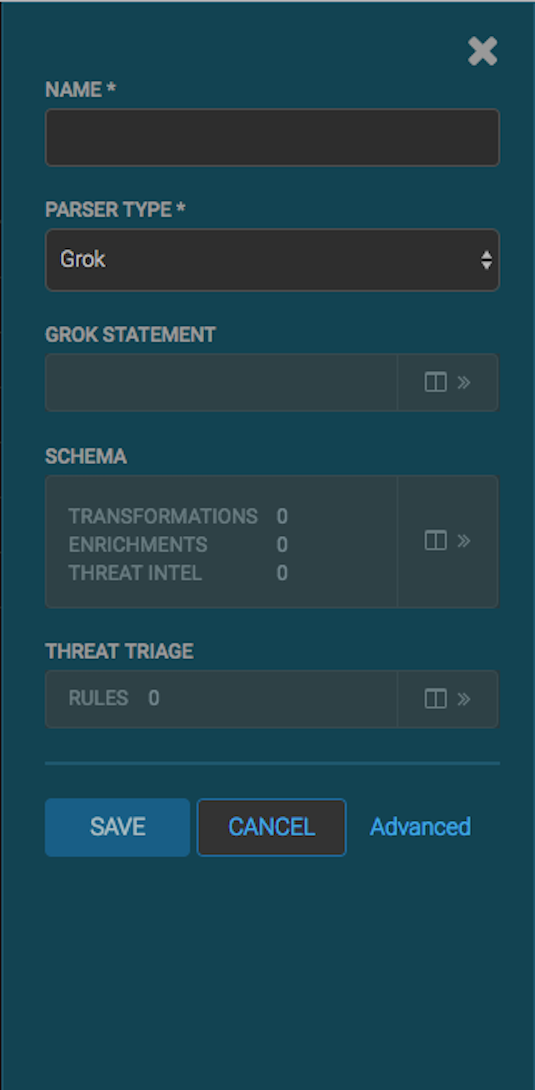
Click
 to view the new sensor panel:
-
In the NAME field, enter the name of the new sensor.
-
In the Kafka Type field, enter the name of the new
sensor.
-
In the Parser Type field, choose the type of parser for the
new sensor (in this example task, Grok).
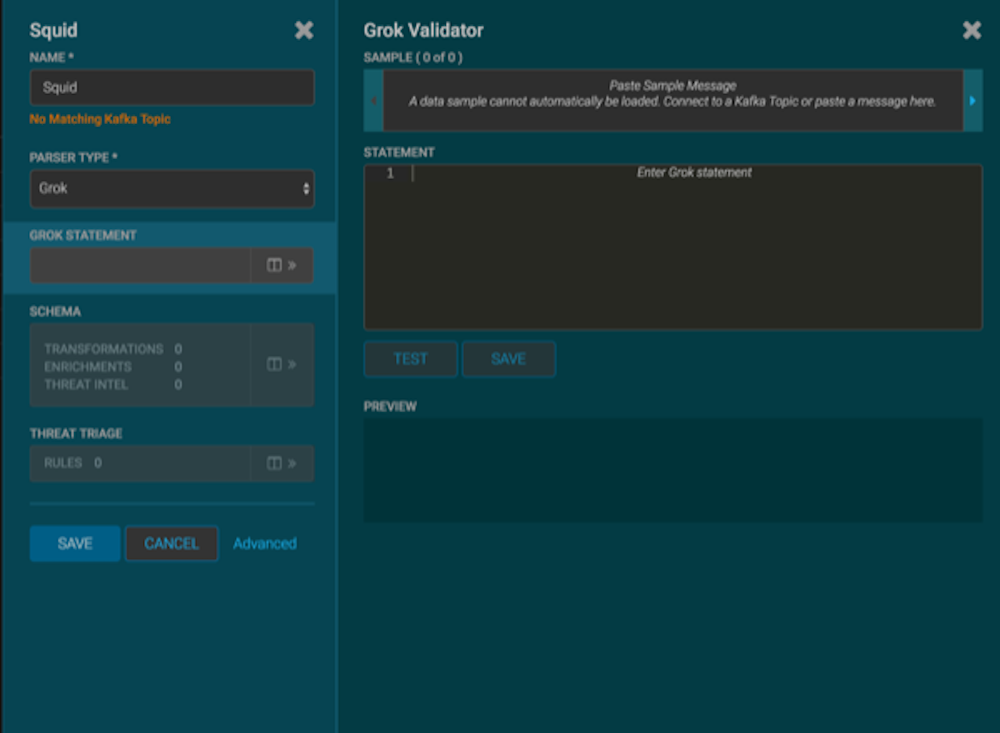
Don't worry if you see "No Matching Kafka Topic." The Kafka topic will be created
automatically when you save.
-
Enter a Grok statement for the new parser:
-
In the Grok Statement box, click
 (expand window) to display the Grok validator
panel:
(expand window) to display the Grok validator
panel:
-
For SAMPLE, enter a sample log entry for the data
source.
-
For STATEMENT, enter the Grok statement you created
for the data source.
The Management UI automatically completes partial words in your Grok
statement as you enter them.
 | Note |
|---|
You must include timestamp to ensure
that the system uses the event time rather than the system time. |
-
Click TEST.
If the validator finds an error, it displays the error information;
otherwise, the valid mapping displays in the PREVIEW
field.
Consider repeating substeps a through c to ensure that your Grok statement
is valid for all sensor logs.
-
Click SAVE to save the sensor information and add it
to the list of sensors.
-
Click the pencil icon to edit the sensor you just added.
-
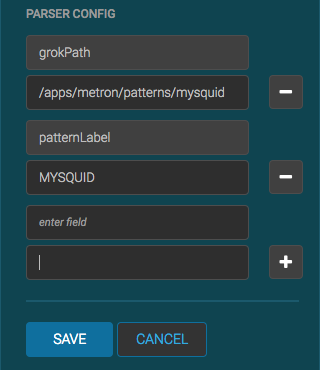
Scroll down to the Parser Config section.
-
In the first open field, indicated by enter field, enter
timestampField.
-
In next open field, enter timestamp.
-
Click Save.
-
Continue to build and test the Grok statement until you have entries for each
element in the log entry.
This new data source processor topology ingests from the
$Kafka topic and then parses the event with the HCP Grok framework using the Grok pattern.
The result is a standard JSON Metron structure that then is added to the "enrichment" Kafka
topic for further processing.