
Parse the Squid Telemetry Event
Launch the HCP Management module:
From the Ambari Dashboard panel, click Metron.
Make sure you have the Summary tab selected.
Select the Metron Management UI from the Summary list.
The Management UI tool should display in a separate browser tab.
Alternatively, you can launch the module from
$METRON_MANAGEMENT_UI_HOST:4200in a browser.Click Sensors on the left side of the window, under Operations.
Click
 (the add button) in the lower right corner of the screen.
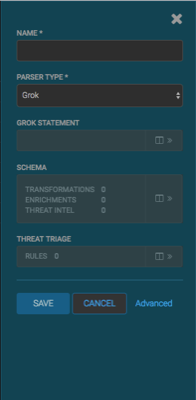
The Management module displays a panel used to create the new sensor.
In the NAME field, enter the name of the sensor.
For our example, we use the name
squid.If a Kafka topic already exists for the sensor name, the module displays a message similar to Kafka Topic Exists. Emitting and displays the name of the Parser Type. You can skip to the next section, Verify Events are Indexed.
If no matching Kafka topic is found, the module displays No Matching Kafka Topic.
In the Parser Type field, choose the type of parser for the new sensor.
If you chose a Grok parser type, the module prompts for a Grok statement.
If no Kafka topic exists for squid, create a Grok statement for the new parser:
In the Grok Statement box, click the
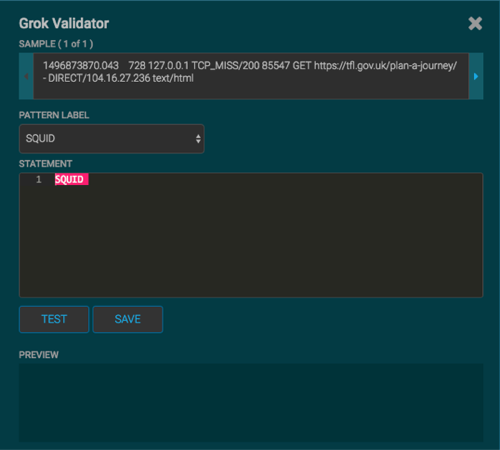
 (expand window button) to display the Grok Validator panel.
Choose or enter a name for the Grok statement in the PATTERN LABEL field.
For our example, we chose SQUID.
If there is no data in the SAMPLE text field, enter a sample log entry for the data source.
To create sample log entries, see Step 15.
Refer to the format of the log entries you determined in Step 11d.
For example, the log entry format for Squid is:
timestamp | time elapsed | remotehost | code/status | bytes | method | URL rfc931 peerstatus/peerhost | type
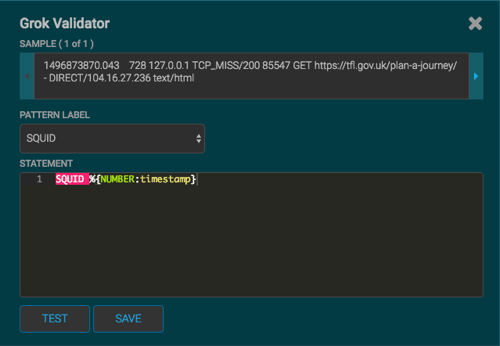
In the STATEMENT field, enter the first element in the sensor log file.
For Squid, the first element in the sensor log file is
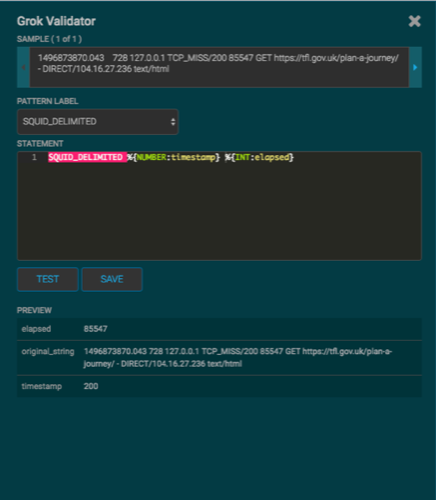
timestampwhich is a number, so we enter%{NUMBER:timestamp}.![[Note]](../common/images/admon/note.png)
Note The Management module automatically completes partial words in your Grok statement as you enter them.
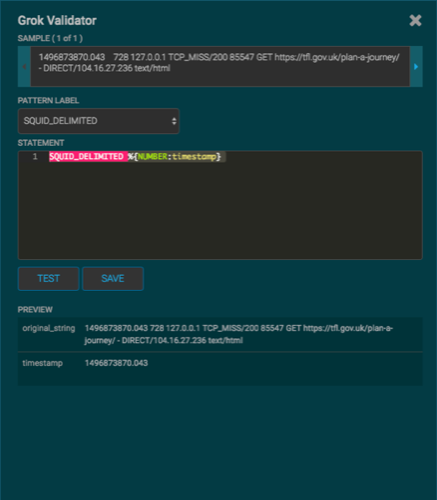
Click TEST.
If the validator finds an error, it displays the error information. If the validation succeeds, it displays the valid mapping in the PREVIEW field.
Because you entered the timestamp element, the validator parses the timestamp correctly and leaves the rest of the information as random data.
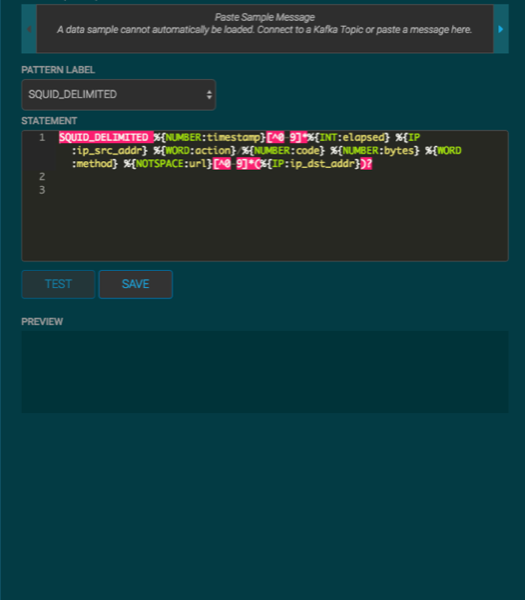
Refer to the log entry format and enter the second element.
For Squid, the second element is
elapsed, so we enter%{INT:elapsed}and click TEST again.Continue to build and test the Grok statement until you have entries for each element in the log entry.
Note You should perform the Grok validation using several different sensor log entries to ensure that the Grok statement is valid for all sensor logs. To display additional sensor log entries, click the forward or backward arrow icon on the side of the SAMPLE text box.
When your Grok statement is complete and valid, click SAVE to save the Grok statement for the sensor.
Click SAVE to save the sensor information and add it to the list of Sensors.
This new data source processor topology ingests from the $Kafka topic and then parses the event with the HCP Grok framework using the Grok pattern. The result is a standard JSON Metron structure that then is added to the "enrichment" Kafka topic for further processing.
Test that a Kafka topic has been created for the Squid parser:
Navigate to the following directory:
/usr/hdp/current/kafka-broker/bin
List all of the Kafka topics:
./kafka-topics.sh --zookeeper localhost:2181 --list
You should see the following list of Kafka topics:
bro
enrichments
ubdexubg
snort
squid