
Configuring a New Data Source Index in the Metron Dashboard
Now that you have an index for the new data source with all of the right data types, you need to tell the Metron dashboard about this index.
Launch the Metron dashboard if you have not already done so:
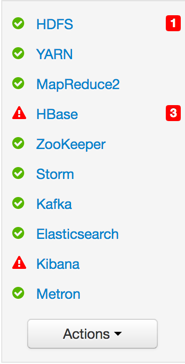
From Ambari, click Kibana in the list of quick tasks.
Select Metron UI from the Quick Links menu in the top center of the window.
Click the Settings tab on the Metron dashboard.
Make sure you have the Indices tab selected, then click +Add New.
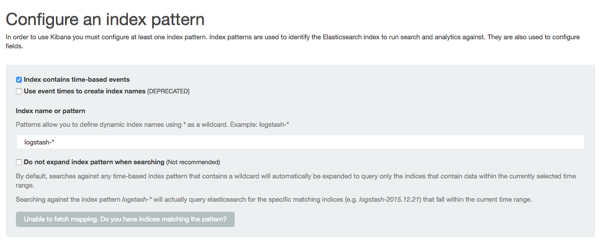
Kibana displays the Configure an index pattern window. Use the index pattern window to identify your telemetry source.
In the Index name or pattern field, enter the name of the index pattern of your data telemetry source.
In most cases the name of the index pattern will match the sensor name. For example, the 'bro' sensor has an index pattern of 'bro-*'.
If your data telemetry source does not contain time-based events, clear the Index contains time-based events check box.
If your data telemetry source does contain time-based events, leave the check box as is. Most of your data telemetry sources will contain time-based events.
Click Create to add the index pattern for your new data telemetry source.
If you would like this new index pattern to be the default, click the Green Star icon (
 ).
).