
Using the Management Module User Interface
This section explains how to use the HCP Management module to parse a new data source and transform data fields.
Although HCP supports both Java and general purpose parsers, the following workflow uses the general purpose parser, Grok.
Determine the format of the new data source’s log entries, so you can parse them:
Look at the different log files that can be created and determine which log file needs to be parsed:
sudo su -
cd /var/log/$NEW_DATASOURCE
ls
The file you want is typically the
access.log, but your data source might use a different name.Generate entries for the log that needs to be parsed so that you can see the format of the entries.
For example:
timestamp | time elapsed | remotehost | code/status | bytes | method | URL rfc931 peerstatus/peerhost | type
Create a Kafka topic for the new data source:
Log in to $KAFKA_HOST as root.
Create a Kafka topic named the same as the new data source:
/usr/hdp/current/kafka-broker/bin/kafka-topics.sh
--zookeeper $ZOOKEEPER_HOST:2181 --create --topic $NEW_DATASOURCE
--partitions 1 --replication-factor 1
List all of the Kafka topics, to ensure that the new topic exists:
/usr/hdp/current/kafka-broker/bin/kafka-topics.sh --zookeeper $ZOOKEEPER_HOST:2181 --list
Create a Grok statement file that defines the Grok expression for the log type you identified in Step 1.
Refer to the Grok documentation for additional details.
Launch the HCP Management module:
From the Ambari Dashboard panel, click Metron.
Make sure you have the Summary tab selected.
Select the Metron Management UI from the Summary list.
The Metron Management UI tool should display in a separate browser tab.
Alternatively, you can launch the module from
$METRON_MANAGEMENT_UI_HOST:4200in a browser.Click Sensors on the left side of the window, under Operations.
Click
 (the add button) in the lower right corner of the screen.
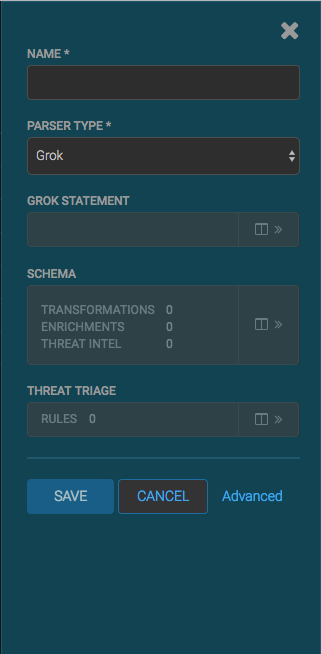
The Management module displays a panel used to create the new sensor.
In the NAME field, enter the name of the new sensor.
If a Kafka topic already exists for the sensor name, the module displays a message similar to Kafka Topic Exists. Emitting. If no matching Kafka topic is found, the module displays No Matching Kafka Topic.
In the Parser Type field, choose the type of parser for the new sensor.
If you chose a Grok parser type and no Kafka type is detected, the module prompts for a Grok Statement.
If no Kafka topic exists for your sensor, create a Kafka topic for the sensor.
In the Kafka Topic text box, click the arrow to display the Configure Kafka Topic dialog box
Enter the partition and replication factor for the Kafka type associated with the new sensor, and then click Save.
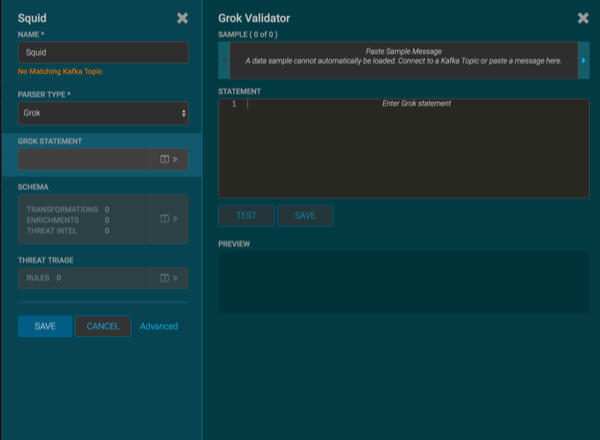
Enter a Grok statement for the new parser:
In the Grok Statement box, click the
 (expand window button) to display the Grok Validator panel.
In the SAMPLE text field, enter a sample log entry for the data source.
In the STATEMENT text field, enter the Grok statement you created for the data source, and then click TEST.
The Management module will automatically complete partial words in your Grok statement as you enter them.
The validator displays the results of the test. If the validator finds an error, it displays the error information. If the validation succeeds, it displays the valid mapping in the PREVIEW field.
![[Note]](../common/images/admon/note.png)
Note You should perform the Grok validation using several different sensor log entries to ensure that the Grok statement is valid for all sensor logs. To display additional sensor log entries, click the forward or backward arrow icon on the side of the SAMPLE text box.
Click SAVE to save the Grok statement for the sensor.
Click SAVE to save the sensor information and add it to the list of Sensors.
This new data source processor topology ingests from the $Kafka topic and then parses the event with the HCP Grok framework using the Grok pattern. The result is a standard JSON Metron structure that then is added to the "enrichment" Kafka topic for further processing.
Add your transformation information:
Note Your sensor must be running and producing data before you can add transformation information.
In the Schema box, click
(expand window button).The Management module populates the panel with message, field, and value information.
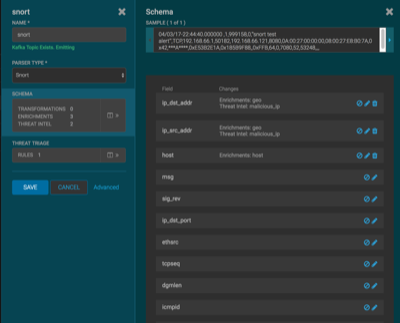
The Sample field, at the top of the panel, displays a parsed version of a sample message from the sensor. The Management module will test your transformations against these parsed messages.
You can use the right and left arrow buttons in the Sample field to view the parsed version of each sample message available from the sensor.
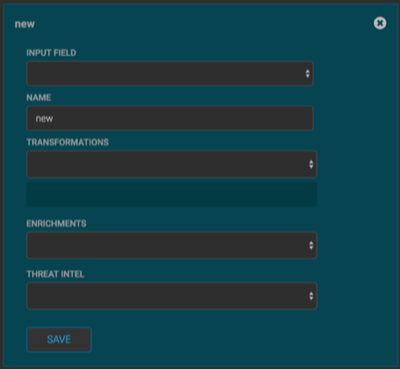
You can apply transformations to an existing field or create a new field. Typically users choose to create and transform a new field, rather than transforming an existing field.
To add a new transformation, either click the
 next to a field or click the
  (plus sign) at the bottom of the Schema
panel.
(plus sign) at the bottom of the Schema
panel.The module displays a new dialog box for your transformations.
In the dialog box, choose the field you want to transform from the INPUT FIELD box, enter the name of the new field in the NAME field, and then choose a function with the appropriate parameters in the TRANSFORMATIONS box.
Click SAVE to save your additions.
The Management module populates the Transforms field with the number of transformations applied to the sensor.
If you change your mind and want to remove a transformation, click the "x" next to the field.
You can also suppress fields with the transformation feature by clicking
 (suppress icon).
This icon prevents the field from being displayed, but it does not remove the field entirely.
Click SAVE in the parser panel to save the transformation information.