
View selected metrics in a Grafana dashboard
Use each Grafana dashboard to visualize multiple metrics
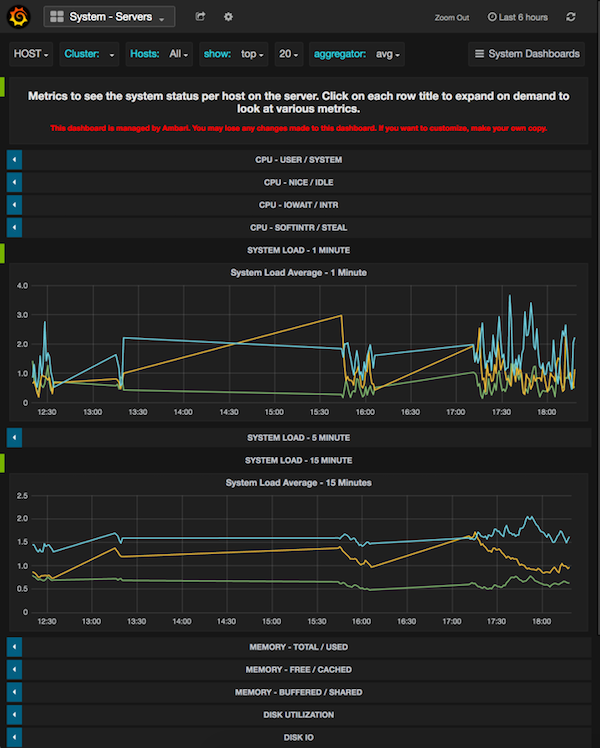
On a dashboard, expand one or more rows to view detailed metrics.
For example, in the System - Servers dashboard, click
System Load Average - 1 Minute.
The row expands to display a chart that shows metrics information. This
example shows the System Load Average - 1 Minute and the System Load Average - 15
Minute rows expanded. Other rows in the System-Servers dashboard remain
collapsed.