
The Hosts view presents your cluster in terms of the hosts on which the services are running. If your cluster is large, you can use the Search box to locate a particular sets of hosts. The filter tool, shown outlined in blue, allows you to focus on only those hosts that are of interest and to sort your result.
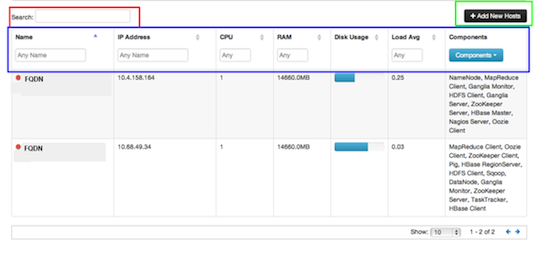
Use the dropdown list in the Components column to locate only the hosts that run the specific components in which you are interested. After you have made your choice, click the Apply button at the bottom of the list.
Note the colored dots next to the FQDN in the main Hosts view. These give you a quick overview of the host status:
Red - At least one master component on that host is down. Hover your mouse to see a tooltip with a list of affected components.
Orange - At least one slave component on that host is down. Hover your mouse to see a tooltip with a list of affected components.
Yellow - Ambari Server has not received a heartbeat from that host for more than 3 minutes.
Green - Normal running state
The trigger for a red condition overrides a trigger for an orange condition, and so on down the list.
To see more detailed information on a specific host, click the host FDQN. The Host Details screen opens.
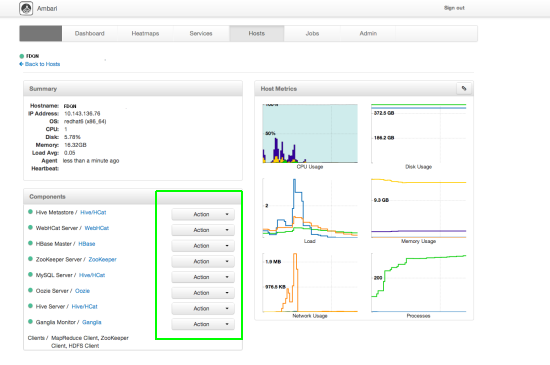
Use the Action dropdowns, outlined in green above, to stop or start a service component running on that host.
To add new hosts, click +Add New Hosts, outlined in green. The Add Host Wizard pops up.
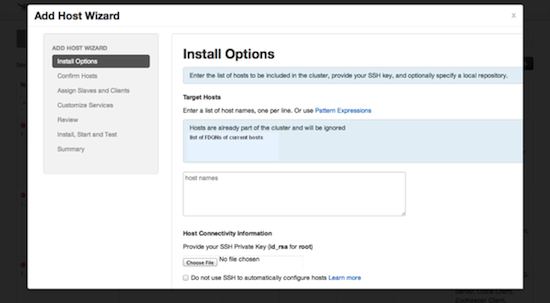
Follow the wizard through the sequence of steps familiar from the Install wizard to add hosts.
